MetLife 2008 Annual Report Download - page 36
Download and view the complete annual report
Please find page 36 of the 2008 MetLife annual report below. You can navigate through the pages in the report by either clicking on the pages listed below, or by using the keyword search tool below to find specific information within the annual report.-
 1
1 -
2
-
3
-
4
-
5
-
6
-
7
-
8
-
9
-
10
-
11
-
12
-
13
-
14
-
15
-
16
-
17
-
18
-
19
-
20
-
21
-
22
-
23
-
24
-
25
-
 26
26 -
 27
27 -
 28
28 -
 29
29 -
 30
30 -
 31
31 -
 32
32 -
 33
33 -
 34
34 -
 35
35 -
 36
36 -
 37
37 -
 38
38 -
 39
39 -
 40
40 -
 41
41 -
 42
42 -
 43
43 -
 44
44 -
 45
45 -
 46
46 -
47
-
48
-
49
-
50
-
51
-
52
-
53
-
54
-
55
-
56
-
57
-
58
-
59
-
60
-
61
-
62
-
63
-
64
-
65
-
66
-
67
-
68
-
69
-
70
-
71
-
72
-
73
-
74
-
75
-
76
-
77
-
78
-
79
-
80
-
81
-
82
-
83
-
84
-
85
-
86
-
87
-
88
-
89
-
90
-
91
-
92
-
93
-
94
-
95
-
96
-
97
-
98
-
99
-
100
-
101
-
102
-
103
-
104
-
105
-
106
-
107
-
108
-
109
-
110
-
111
-
112
-
113
-
114
-
115
-
116
-
117
-
118
-
119
-
120
-
121
-
122
-
123
-
124
-
125
-
126
-
127
-
128
-
129
-
130
-
131
-
132
-
133
-
134
-
135
-
136
-
137
-
138
-
139
-
140
-
141
-
142
-
143
-
144
-
145
-
146
-
147
-
148
-
149
-
150
-
151
-
152
-
153
-
154
-
155
-
156
-
157
-
158
-
159
-
160
-
161
-
162
-
163
-
164
-
165
-
166
-
167
-
168
-
169
-
170
-
171
-
172
-
173
-
174
-
175
-
176
-
177
-
178
-
179
-
180
-
181
-
182
-
183
-
184
-
185
-
186
-
187
-
188
-
189
-
190
-
191
-
192
-
193
-
194
-
195
-
196
-
197
-
198
-
199
-
200
-
201
-
202
-
203
-
204
-
205
-
206
-
207
-
208
-
209
-
210
-
211
-
212
-
213
-
214
-
215
-
216
-
217
-
218
-
219
-
220
-
221
-
222
-
223
-
224
-
225
-
226
-
227
-
228
-
229
-
230
-
231
-
232
-
233
-
234
-
235
-
236
-
237
-
238
-
239
-
240
 |
 |
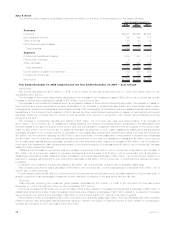
Excluding the impact of net investment gains (losses), income from continuing operations decreased by $1,216 million, net of income
tax, from the prior year.
Thedecreaseinincomefromcontinuingoperationsfortheyearwasdrivenbythefollowingitems:
• Higher DAC amortization of $837 million, net of income tax, related to lower expected future gross profits due to separate account
balance decreases resulting from recent market declines, higher net investment gains primarily due to net derivative gains and the
reduction in expected cumulative earnings of the closed block partially offset by a reduction in actual earnings of the closed block
and changes in assumptions used to estimate future gross profits and margins.
• A decrease in interest margins of $318 million, net of income tax. Interest margins relate primarily to the general account portion of
investment-type products. Management attributed a $279 million decrease to the deferred annuity business and a $39 million
decrease to other investment-type products, both net of income tax. The decrease in interest margin was primarily attributable to a
decline in net investment income due to lower returns on other limited partnership interests, real estate joint ventures, other invested
assets including derivatives, and short term investments, all of which were partially offset by higher securities lending results. Interest
margin is the difference between interest earned and interest credited to policyholder account balances related to the general
account on these businesses. Interest earned approximates net investment income on invested assets attributed to these busi-
nesses with net adjustments for other non-policyholder elements. Interest credited approximates the amount recorded in interest
credited to policyholder account balances. Interest credited to policyholder account balances is subject to contractual terms,
including some minimum guarantees, and may reflect actions by management to respond to competitive pressures. Interest credited
to policyholder account balances tends to move in a manner similar to market interest rate movements, subject to any minimum
guarantees and, therefore, generally does not, but it may introduce volatility in expense.
• Unfavorable underwriting results in life products of $68 million, net of income tax. Underwriting results are generally the difference
between the portion of premium and fee income intended to cover mortality, morbidity or other insurance costs less claims incurred
and the change in insurance-related liabilities. Underwriting results are significantly influenced by mortality, morbidity, or other
insurance-related experience trends, as well as the reinsurance activity related to certain blocks of business. Consequently, results
can fluctuate from year to year.
• An increase in interest credited to policyholder account balances of $39 million, net of income tax, due primarily to lower amortization
of the excess interest reserves on acquired annuity and universal life blocks of business.
• Higher annuity benefits of $29 million, net of income tax, primarily due to higher guaranteed annuity benefit costs net of related
hedging results and higher amortization of sales inducements, partially offset by revisions to policyholder benefits in both years.
• Lower universal life and investment-type product policy fees combined with other revenues of $22 million, net of income tax, primarily
resulting from lower average separate account balances due to unfavorable equity market performance during the current year, as
well as revisions to management’s assumptions used to determine estimated gross profits and margins. These decreases were
partially offset by universal life business growth over the prior year.
• An increase in policyholder dividends of $16 million, net of income tax, due to growth in the business.
These aforementioned decreases in income from continuing operations were partially offset by the following items:
• Lower expenses of $96 million, net of income tax, primarily due to a decrease in non-deferrable volume related expenses and a write-
off of a receivable from one of the Company’s joint venture partners in the prior year, partially offset by the impact of revisions to
certain pension and post retirement liabilities in the current year.
• Higher net investment income on blocks of business not driven by interest margins of $12 million, net of income tax.
The change in effective tax rates between years accounts for the remainder of the increase in income from continuing operations.
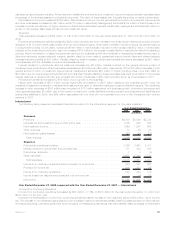
Revenues
Total revenues, excluding net investment gains (losses), decreased by $586 million, or 4%, to $14,961 million for the year ended
December 31, 2008 from $15,547 million for the prior year.
Premiums remained flat for the year ended December 31, 2008 compared to the prior year. Premiums were impacted by an increase in
immediate annuity premiums of $23 million and growth in premiums from other life products of $60 million driven by increased renewals of
traditional life business. These increases were completely offset by an $83 million decline in premiums associated with the Company’s
closed block of business in line with expectations.
Universal life and investment-type product policy fees combined with other revenues decreased by $70 million primarily resulting from
lower average separate account balances due to unfavorable equity market performance during the current year, as well as revisions to
management’s assumptions used to determine estimated gross profits and margins. These decreases were partially offset by universal life
business growth over the prior year. Policy fees from variable life and annuity and investment-type products are typically calculated as a
percentage of the average assets in policyholder accounts. The value of these assets can fluctuate depending on equity performance.
Net investment income decreased by $516 million. Net investment income from the general account portion of investment-type
products decreased by $499 million, while other businesses decreased by $17 million. Management attributed $566 million of the
decrease to a decrease in yields, primarily due to lower returns on other limited partnership interests, real estate joint ventures, other
invested assets including derivatives, and short term investments, all of which were partially offset by higher securities lending results.
Management attributed a $50 million increase to a higher average asset base across various investment types. Average invested assets
are calculated on cost basis without unrealized gains and losses.
Expenses
Total expenses increased by $1,293 million, or 10%, to $14,689 million for the year ended December 31, 2008 from $13,396 million for
the prior year.
Policyholder benefits and claims increased by $114 million. This was primarily due to unfavorable equity market performance during the
current year, which resulted in higher guaranteed annuity benefit costs net of related hedging results of $113 million and higher
amortization of sales inducements of $69 million. These increases were partially offset by $137 million of revisions to policyholder
benefits in the current year. Additionally, unfavorable mortality in the life products, including the closed block, contributed $69 million to this
increase.
33MetLife, Inc.