MetLife 2008 Annual Report Download - page 203
Download and view the complete annual report
Please find page 203 of the 2008 MetLife annual report below. You can navigate through the pages in the report by either clicking on the pages listed below, or by using the keyword search tool below to find specific information within the annual report.-
 1
1 -
2
-
3
-
4
-
5
-
6
-
7
-
8
-
9
-
10
-
11
-
12
-
13
-
14
-
15
-
16
-
17
-
18
-
19
-
20
-
21
-
22
-
23
-
24
-
25
-
26
-
27
-
28
-
29
-
30
-
31
-
32
-
33
-
34
-
35
-
36
-
37
-
38
-
39
-
40
-
41
-
42
-
43
-
44
-
45
-
46
-
47
-
48
-
49
-
50
-
51
-
52
-
53
-
54
-
55
-
56
-
57
-
58
-
59
-
60
-
61
-
62
-
63
-
64
-
65
-
66
-
67
-
68
-
69
-
70
-
71
-
72
-
73
-
74
-
75
-
76
-
77
-
78
-
79
-
80
-
81
-
82
-
83
-
84
-
85
-
86
-
87
-
88
-
89
-
90
-
91
-
92
-
93
-
94
-
95
-
96
-
97
-
98
-
99
-
100
-
101
-
102
-
103
-
104
-
105
-
106
-
107
-
108
-
109
-
110
-
111
-
112
-
113
-
114
-
115
-
116
-
117
-
118
-
119
-
120
-
121
-
122
-
123
-
124
-
125
-
126
-
127
-
128
-
129
-
130
-
131
-
132
-
133
-
134
-
135
-
136
-
137
-
138
-
139
-
140
-
141
-
142
-
143
-
144
-
145
-
146
-
147
-
148
-
149
-
150
-
151
-
152
-
153
-
154
-
155
-
156
-
157
-
158
-
159
-
160
-
161
-
162
-
163
-
164
-
165
-
166
-
167
-
168
-
169
-
170
-
171
-
172
-
173
-
174
-
175
-
176
-
177
-
178
-
179
-
180
-
181
-
182
-
183
-
184
-
185
-
186
-
187
-
188
-
189
-
190
-
191
-
192
-
 193
193 -
 194
194 -
 195
195 -
 196
196 -
 197
197 -
 198
198 -
 199
199 -
 200
200 -
 201
201 -
 202
202 -
 203
203 -
 204
204 -
 205
205 -
 206
206 -
 207
207 -
 208
208 -
 209
209 -
 210
210 -
 211
211 -
 212
212 -
 213
213 -
214
-
215
-
216
-
217
-
218
-
219
-
220
-
221
-
222
-
223
-
224
-
225
-
226
-
227
-
228
-
229
-
230
-
231
-
232
-
233
-
234
-
235
-
236
-
237
-
238
-
239
-
240
 |
 |

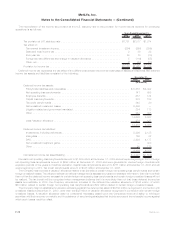
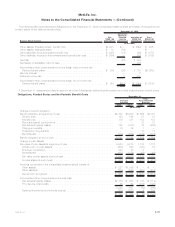
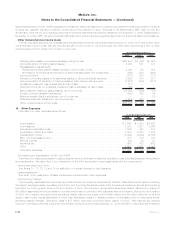
The aggregate projected benefit obligation and aggregate fair value of plan assets for the pension plans were as follows:
2008 2007 2008 2007 2008 2007
Qualified Plan Non-Qualified
Plan Total
December 31,
(In millions)
Aggregate fair value of plan assets (principally Company contracts) . . $5,559 $6,520 $ — $ — $5,559 $6,520
Aggregate projected benefit obligation . . . . . . . . . . . . . . . . . . . . . 5,356 5,139 685 583 6,041 5,722
Over (under) funded . . . . . . . . . . . . . . . . . . . . . . . . . . . . . . . . . $ 203 $1,381 $(685) $(583) $ (482) $ 798
The accumulated benefit obligation for all defined benefit pension plans was $5,620 million and $5,302 million at December 31, 2008
and 2007, respectively.
Information for pension plans with an accumulated benefit obligation in excess of plan assets is as follows:
2008 2007
December 31,
(In millions)
Projectedbenefitobligation........................................................ $708 $597
Accumulatedbenefitobligation ..................................................... $590 $517
Fairvalueofplanassets.......................................................... $ — $ —
Information for pension and other postretirement benefit plans with a projected benefit obligation in excess of plan assets is as follows:
2008 2007 2008 2007
Pension
Benefits
Other
Postretirement
Benefits
December 31,
(In millions)
Projectedbenefitobligation .......................................... $712 $602 $1,632 $1,599
Fairvalueofplanassets ............................................ $ 4 $ 4 $1,011 $1,183
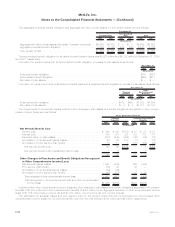
The components of net periodic benefit cost and other changes in plan assets and benefit obligations recognized in other compre-
hensive income (loss) were as follows:
2008 2007 2006 2008 2007 2006
Pension
Benefits Other Postretirement
Benefits
Years Ended December 31,
(In millions)
Net Periodic Benefit Cost
Servicecost........................................ $ 164 $162 $159 $ 21 $ 27 $ 35
Interestcost........................................ 379 351 332 103 103 116
Expectedreturnonplanassets............................ (517) (505) (452) (86) (86) (79)
Amortizationofnetactuarial(gains)losses .................... 24 68 128 (1) — 22
Amortizationofpriorservicecost(credit) ..................... 15 17 8 (37) (36) (36)
Netperiodicbenefitcost .............................. 65 93 $175 — 8 $ 58
Netperiodicbenefitcostofsubsidiaryheld-for-sale............. 1 5 — 1
66 98 — 9
Other Changes in Plan Assets and Benefit Obligations Recognized
in Other Comprehensive Income (Loss)
Netactuarial(gains)losses .............................. 1,561 (432) 259 (440)
Priorservicecost(credit)................................ (19) 40 36 —
Amortizationofnetactuarial(gains)losses .................... (24) (68) 1 —
Amortizationofpriorservicecost(credit) ..................... (15) (17) 37 36
Total recognized in other comprehensive income (loss) . . . . . . . . . . . . . . . 1,503 (477) 333 (404)
Total recognized in net periodic benefit cost and other comprehensive
income(loss) .................................... $1,569 $(379) $333 $(395)
Included within other comprehensive income (loss) are other changes in plan assets and benefit obligations associated with pension
benefits of $1,503 million and other postretirement benefits of $333 million for an aggregate reduction in other comprehensive income
(loss) of $1,836 million before income tax and $1,203 million, net of income tax and minority interest.
The estimated net actuarial losses and prior service cost for the pension plans that will be amortized from accumulated other
comprehensive income (loss) into net periodic benefit cost over the next year are $198 million and $9 million, respectively.
F-80 MetLife, Inc.
MetLife, Inc.
Notes to the Consolidated Financial Statements — (Continued)