MetLife 2008 Annual Report Download - page 32
Download and view the complete annual report
Please find page 32 of the 2008 MetLife annual report below. You can navigate through the pages in the report by either clicking on the pages listed below, or by using the keyword search tool below to find specific information within the annual report.-
 1
1 -
2
-
3
-
4
-
5
-
6
-
7
-
8
-
9
-
10
-
11
-
12
-
13
-
14
-
15
-
16
-
17
-
18
-
19
-
20
-
21
-
 22
22 -
 23
23 -
 24
24 -
 25
25 -
 26
26 -
 27
27 -
 28
28 -
 29
29 -
 30
30 -
 31
31 -
 32
32 -
 33
33 -
 34
34 -
 35
35 -
 36
36 -
 37
37 -
 38
38 -
 39
39 -
 40
40 -
 41
41 -
 42
42 -
43
-
44
-
45
-
46
-
47
-
48
-
49
-
50
-
51
-
52
-
53
-
54
-
55
-
56
-
57
-
58
-
59
-
60
-
61
-
62
-
63
-
64
-
65
-
66
-
67
-
68
-
69
-
70
-
71
-
72
-
73
-
74
-
75
-
76
-
77
-
78
-
79
-
80
-
81
-
82
-
83
-
84
-
85
-
86
-
87
-
88
-
89
-
90
-
91
-
92
-
93
-
94
-
95
-
96
-
97
-
98
-
99
-
100
-
101
-
102
-
103
-
104
-
105
-
106
-
107
-
108
-
109
-
110
-
111
-
112
-
113
-
114
-
115
-
116
-
117
-
118
-
119
-
120
-
121
-
122
-
123
-
124
-
125
-
126
-
127
-
128
-
129
-
130
-
131
-
132
-
133
-
134
-
135
-
136
-
137
-
138
-
139
-
140
-
141
-
142
-
143
-
144
-
145
-
146
-
147
-
148
-
149
-
150
-
151
-
152
-
153
-
154
-
155
-
156
-
157
-
158
-
159
-
160
-
161
-
162
-
163
-
164
-
165
-
166
-
167
-
168
-
169
-
170
-
171
-
172
-
173
-
174
-
175
-
176
-
177
-
178
-
179
-
180
-
181
-
182
-
183
-
184
-
185
-
186
-
187
-
188
-
189
-
190
-
191
-
192
-
193
-
194
-
195
-
196
-
197
-
198
-
199
-
200
-
201
-
202
-
203
-
204
-
205
-
206
-
207
-
208
-
209
-
210
-
211
-
212
-
213
-
214
-
215
-
216
-
217
-
218
-
219
-
220
-
221
-
222
-
223
-
224
-
225
-
226
-
227
-
228
-
229
-
230
-
231
-
232
-
233
-
234
-
235
-
236
-
237
-
238
-
239
-
240
 |
 |
invested assets including derivatives, and mortgage loans, partially offset by improved securities lending results. Management anticipates
that net investment income and the related yields on other limited partnerships and real estate joint ventures could decline further, which
may reduce net investment income during the remainder of 2009 due to continued volatility in equity, real estate, and credit markets and
therefore may continue to reduce interest margins during 2009. Interest margin is the difference between interest earned and interest
credited to policyholder account balances. Interest earned approximates net investment income on investable assets attributed to the
segment with minor adjustments related to the consolidation of certain separate accounts and other minor non-policyholder elements.
Interest credited is the amount attributed to insurance products, recorded in policyholder benefits and claims, and the amount credited to
policyholder account balances for investment-type products, recorded in interest credited to policyholder account balances. Interest
credited on insurance products reflects the current period impact of the interest rate assumptions established at issuance or acquisition.
Interest credited to policyholder account balances is subject to contractual terms, including some minimum guarantees. This tends to
move in a manner similar to market interest rate movements, and may reflect actions by management to respond to competitive pressures
and, therefore, generally does not, but it may, introduce volatility in expense.
Partially offsetting these decreases in income from continuing operations was a decline in other expenses, due in part to lower
expenses related to DAC amortization of $65 million, net of income tax, primarily due to the impact of a charge of $40 million, net of income
tax, in the prior year, due to the impact of the implementation of SOP 05-1 and a decrease of $12 million, net of income tax, mainly from
amortization refinements in the current year. Partially offsetting the decline in DAC amortization was the net impact of revisions to certain
assets and liabilities in the prior and current year of $19 million, net of income tax. The remaining increase in operating expenses was more
than offset by the remaining increase in premiums, fees, and other revenues. A portion of premiums, fees and other revenues is intended to
cover the Company’s operating expenses or non-insurance related expenses. As many of those expenses are fixed expenses, man-
agement may not be able to reduce those expenses, in a timely manner, proportionate with declining revenues that may result from
customer-related bankruptcies, customer’s reduction of coverage stemming from plan changes, elimination of retiree coverage, or a
reduction in covered payroll.
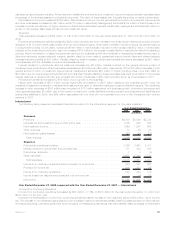
Revenues
Total revenues, excluding net investment gains (losses), increased by $2,064 million, or 9%, to $24,160 million for the year ended
December 31, 2008 from $22,096 million for the comparable 2007 period.
The increase of $2,705 million in premiums, fees and other revenues was largely due to increases in the retirement & savings, non-
medical health & other and group life businesses of $1,451 million, $749 million and $505 million, respectively.
An increase in the retirement & savings business was primarily due to increases in premiums in the group institutional annuity, structured
settlement and global GIC businesses of $1,310 million, $222 million and $42 million, respectively. The increase in both group institutional
annuity and the structured settlement businesses were primarily due to higher sales. The increase in the group institutional annuity
business was primarily due to large domestic sales and the first significant sales in the United Kingdom business in the current year. The
global GIC related increase was primarily the result of fees earned on the surrender of a GIC contract. Partially offsetting these increases
was the impact of lower sales in the income annuity business of $108 million. The remaining increase in the retirement & savings business
was attributed to business growth across several products. Premiums, fees and other revenues from retirement & savings products are
significantly influenced by large transactions and the demand for certain of these products can decline during periods of volatile credit and
investment markets and, as a result, can fluctuate from period to period.
The growth in the non-medical health & other business was largely due to increases in the dental, disability, AD&D, and IDI businesses
of $734 million. The increase in the dental business was primarily due to organic growth in the business and the impact of an acquisition
that closed in the first quarter of 2008. The increases in the disability, AD&D, and IDI businesses were primarily due to continued growth in
the business. Partially offsetting these increases was a decline in the LTC business of $5 million, primarily attributable to a $74 million
decrease, which management attributed to a shift to deposit liability-type contracts during the latter part of the prior year. This decline in the
LTC business was almost completely offset by current year growth in the business. The remaining increase in the non-medical health &
other business was attributed to business growth across several products.
The increase in group life business of $505 million was primarily due to a $443 million increase in term life, which was largely attributable
to business growth, partially offset by a decrease in assumed reinsurance. COLI and universal life products increased $47 million and
$37 million, respectively. The increase in COLI was largely attributable to the impact of fees earned on the cancellation of a portion of a
stable value wrap contract of $44 million. In addition, continued business growth and the impact of higher experience rated refunds in the
prior year contributed to this increase. Partially offsetting these increases in COLI was the impact of fees earned on a large sale in the prior
year. The increase in universal life products was primarily attributable to business growth in the current year. Partially offsetting these
increases was a decline in life insurance sold to postretirement benefit plans of $21 million, primarily the result of the impact of a large sale
in the prior year. Premiums, fees and other revenues from group life business can and will fluctuate based, in part, on the covered payroll of
customers. In periods of high unemployment, revenue may be impacted. Revenue may also be impacted as a result of customer-related
bankruptcies, customer’s reduction of coverage stemming from plan changes or elimination of retiree coverage.
Partially offsetting the increase in premiums, fees and other revenues was a decrease in net investment income of $641 million.
Management attributed a $1,246 million decrease in net investment income to a decrease in yields, primarily due to lower returns on other
limited partnership interests, real estate joint ventures, fixed maturity securities, other invested assets including derivatives, and mortgage
loans, partially offset by improved securities lending results. Management anticipates that net investment income and the related yields on
other limited partnership interests and real estate joint ventures could decline further, which may reduce net investment income during
2009 due to continued volatility in equity, real estate, and credit markets. Partially offsetting this decrease in yields was a $605 million
increase, attributed to growth in average invested assets calculated on a cost basis without unrealized gains and losses, primarily within
mortgage loans, other limited partnership interests, other invested assets including derivatives, and real estate joint ventures.
Expenses
Total expenses increased by $2,176 million, or 11%, to $21,514 million for the year ended December 31, 2008 from $19,338 million for
the comparable 2007 period. The increase in expenses was primarily attributable to policyholder benefits and claims of $2,720 million,
partially offset by lower interest credited to policyholder account balances of $513 million and lower other expenses of $31 million.
29MetLife, Inc.