MetLife 2008 Annual Report Download - page 114
Download and view the complete annual report
Please find page 114 of the 2008 MetLife annual report below. You can navigate through the pages in the report by either clicking on the pages listed below, or by using the keyword search tool below to find specific information within the annual report.-
 1
1 -
2
-
3
-
4
-
5
-
6
-
7
-
8
-
9
-
10
-
11
-
12
-
13
-
14
-
15
-
16
-
17
-
18
-
19
-
20
-
21
-
22
-
23
-
24
-
25
-
26
-
27
-
28
-
29
-
30
-
31
-
32
-
33
-
34
-
35
-
36
-
37
-
38
-
39
-
40
-
41
-
42
-
43
-
44
-
45
-
46
-
47
-
48
-
49
-
50
-
51
-
52
-
53
-
54
-
55
-
56
-
57
-
58
-
59
-
60
-
61
-
62
-
63
-
64
-
65
-
66
-
67
-
68
-
69
-
70
-
71
-
72
-
73
-
74
-
75
-
76
-
77
-
78
-
79
-
80
-
81
-
82
-
83
-
84
-
85
-
86
-
87
-
88
-
89
-
90
-
91
-
92
-
93
-
94
-
95
-
96
-
97
-
98
-
99
-
100
-
101
-
102
-
103
-
 104
104 -
 105
105 -
 106
106 -
 107
107 -
 108
108 -
 109
109 -
 110
110 -
 111
111 -
 112
112 -
 113
113 -
 114
114 -
 115
115 -
 116
116 -
 117
117 -
 118
118 -
 119
119 -
 120
120 -
 121
121 -
 122
122 -
 123
123 -
 124
124 -
125
-
126
-
127
-
128
-
129
-
130
-
131
-
132
-
133
-
134
-
135
-
136
-
137
-
138
-
139
-
140
-
141
-
142
-
143
-
144
-
145
-
146
-
147
-
148
-
149
-
150
-
151
-
152
-
153
-
154
-
155
-
156
-
157
-
158
-
159
-
160
-
161
-
162
-
163
-
164
-
165
-
166
-
167
-
168
-
169
-
170
-
171
-
172
-
173
-
174
-
175
-
176
-
177
-
178
-
179
-
180
-
181
-
182
-
183
-
184
-
185
-
186
-
187
-
188
-
189
-
190
-
191
-
192
-
193
-
194
-
195
-
196
-
197
-
198
-
199
-
200
-
201
-
202
-
203
-
204
-
205
-
206
-
207
-
208
-
209
-
210
-
211
-
212
-
213
-
214
-
215
-
216
-
217
-
218
-
219
-
220
-
221
-
222
-
223
-
224
-
225
-
226
-
227
-
228
-
229
-
230
-
231
-
232
-
233
-
234
-
235
-
236
-
237
-
238
-
239
-
240
 |
 |

could cause the value of these liabilities to decrease. The Company uses derivative instruments to mitigate the liability exposure, risk of
loss and the volatility of net income associated with these liabilities. The derivative instruments used are primarily equity and treasury
futures, equity options and variance swaps, and interest rate swaps. The change in valuation arising from the Company’s own credit is not
hedged.
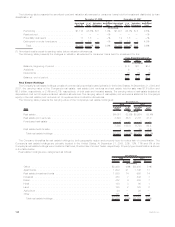
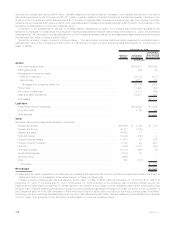
The table below contains the carrying value of the derivatives hedging guarantees accounted for as embedded derivatives:
Notional
Amount Assets Liabilities Notional
Amount Assets Liabilities
Fair Value Fair Value
2008 2007
December 31,
(In millions)
Interestrateswaps ........................ $ 5,572 $ 632 $ 7 $ 998 $ 32 $ 2
Financialfutures.......................... 13,924 37 121 4,039 51 14
Foreigncurrencyforwards ................... 1,017 49 4 489 3 —
Options ............................... 5,424 2,065 — 4,906 554 1
Financialforwards......................... 8,835 396 — 5,309 46 1
Total.................................. $34,772 $3,179 $132 $15,741 $686 $18
Included in net investment gains (losses) for the year ended December 31, 2008 were gains of $3,440 million related to the change in
estimated fair value of the above derivatives.
Guarantees, including portions thereof, accounted for under SOP 03-1 have liabilities established that are included in future policy
benefits. Guarantees accounted for in this manner include GMDBs, the life-contingent portion of certain GMWB, and the portion of GMIB
that require annuitization. These liabilities are accrued over the life of the contract in proportion to actual and future expected policy
assessments based on the level of guaranteed minimum benefits generated using multiple scenarios of separate account returns. The
scenarios use best estimate assumptions consistent with those used to amortize deferred acquisition costs. When current estimates of
future benefits exceed those previously projected or when current estimates of future assessments are lower than those previously
projected, the SOP 03-1 reserves will increase, resulting in a current period charge to net income. The opposite result occurs when the
current estimates of future benefits are lower than that previously projected or when current estimates of future assessments exceed those
previously projected. At each reporting period, the Company updates the actual amount of business remaining in-force, which impacts
expected future assessments and the projection of estimated future benefits resulting in a current period charge or increase to earnings.
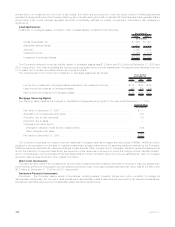
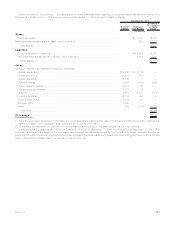
The table below contains the carrying value for guarantees included in Future Policy Benefits:
2008 2007
December 31,
(In millions)
Individual:
Guaranteedminimumdeathbenefit.............................................. $204 $ 72
Guaranteedminimumincomebenefit............................................. 403 74
International:
Guaranteedminimumdeathbenefit.............................................. 39 2
Total.................................................................. $646 $148
Included in policyholder benefits and claims for the year ended December 31, 2008 is a charge of $502 million related to the change in
liabilities for the above guarantees.
The carrying amount of guarantees accounted for as SOP 03-1 liabilities can change significantly during periods of sizable and
sustained shifts in equity market performance, increased equity volatility, or changes in interest rates. The Company uses reinsurance in
combination with derivative instruments to mitigate the liability exposure, risk of loss and the volatility of net income associated with these
liabilities. Derivative instruments used are primarily equity and treasury futures.
Included in policyholder benefits and claims associated with the hedging of the guarantees in future policy benefits for the year ended
December 31, 2008 were gains of $182 million related to reinsurance treaties containing embedded derivatives carried at estimated fair
value and gains of $331 million related to freestanding derivatives.
While the Company believes that the hedging strategies employed for guarantees included in both policyholder account balances and
in future policy benefits, as well as other management actions, have mitigated the risks related to these benefits, the Company remains
liable for the guaranteed benefits in the event that reinsurers or derivative counterparties are unable or unwilling to pay. Certain of the
Company’s reinsurance agreements and derivative positions are collateralized and derivatives positions are subject to master netting
agreements, both of which, significantly reduces the exposure to counterparty risk. In addition, the Company is subject to the risk that
hedging and other management procedures prove ineffective or that unanticipated policyholder behavior or mortality, combined with
adverse market events, produces economic losses beyond the scope of the risk management techniques employed. Lastly, because the
valuation of the guarantees accounted for as embedded derivatives includes an adjustment for the Company’s own credit that is not
hedged, changes in the Company’s own credit may result in significant volatility in net income.
Other Policyholder Funds
Other policyholder funds include policy and contract claims, unearned revenue liabilities, premiums received in advance, policyholder
dividends due and unpaid, and policyholder dividends left on deposit.
111MetLife, Inc.