MetLife 2008 Annual Report Download - page 101
Download and view the complete annual report
Please find page 101 of the 2008 MetLife annual report below. You can navigate through the pages in the report by either clicking on the pages listed below, or by using the keyword search tool below to find specific information within the annual report.-
 1
1 -
2
-
3
-
4
-
5
-
6
-
7
-
8
-
9
-
10
-
11
-
12
-
13
-
14
-
15
-
16
-
17
-
18
-
19
-
20
-
21
-
22
-
23
-
24
-
25
-
26
-
27
-
28
-
29
-
30
-
31
-
32
-
33
-
34
-
35
-
36
-
37
-
38
-
39
-
40
-
41
-
42
-
43
-
44
-
45
-
46
-
47
-
48
-
49
-
50
-
51
-
52
-
53
-
54
-
55
-
56
-
57
-
58
-
59
-
60
-
61
-
62
-
63
-
64
-
65
-
66
-
67
-
68
-
69
-
70
-
71
-
72
-
73
-
74
-
75
-
76
-
77
-
78
-
79
-
80
-
81
-
82
-
83
-
84
-
85
-
86
-
87
-
88
-
89
-
90
-
 91
91 -
 92
92 -
 93
93 -
 94
94 -
 95
95 -
 96
96 -
 97
97 -
 98
98 -
 99
99 -
 100
100 -
 101
101 -
 102
102 -
 103
103 -
 104
104 -
 105
105 -
 106
106 -
 107
107 -
 108
108 -
 109
109 -
 110
110 -
 111
111 -
112
-
113
-
114
-
115
-
116
-
117
-
118
-
119
-
120
-
121
-
122
-
123
-
124
-
125
-
126
-
127
-
128
-
129
-
130
-
131
-
132
-
133
-
134
-
135
-
136
-
137
-
138
-
139
-
140
-
141
-
142
-
143
-
144
-
145
-
146
-
147
-
148
-
149
-
150
-
151
-
152
-
153
-
154
-
155
-
156
-
157
-
158
-
159
-
160
-
161
-
162
-
163
-
164
-
165
-
166
-
167
-
168
-
169
-
170
-
171
-
172
-
173
-
174
-
175
-
176
-
177
-
178
-
179
-
180
-
181
-
182
-
183
-
184
-
185
-
186
-
187
-
188
-
189
-
190
-
191
-
192
-
193
-
194
-
195
-
196
-
197
-
198
-
199
-
200
-
201
-
202
-
203
-
204
-
205
-
206
-
207
-
208
-
209
-
210
-
211
-
212
-
213
-
214
-
215
-
216
-
217
-
218
-
219
-
220
-
221
-
222
-
223
-
224
-
225
-
226
-
227
-
228
-
229
-
230
-
231
-
232
-
233
-
234
-
235
-
236
-
237
-
238
-
239
-
240
 |
 |

December 31, 2008 has been reduced to $5.0 billion from $15.8 billion as of November 30, 2008. Of the $5.0 billion of estimated fair value
of the securities related to the cash collateral on open at December 31, 2008, $4.4 billion were U.S. Treasury and agency securities which,
if put to the Company, can be immediately sold to satisfy the cash requirements. The remainder of the securities on loan are primarily
U.S. Treasury and agency securities, and very liquid residential mortgage-backed securities. Within the U.S. Treasury securities on loan,
they are primarily holdings of on-the-run U.S. Treasury securities, the most liquid U.S. Treasury securities available. If these high quality
securities that are on loan are put back to the Company, the proceeds from immediately selling these securities can be used to satisfy the
related cash requirements. The estimated fair value of the reinvestment portfolio acquired with the cash collateral was $19.5 billion at
December 31, 2008, and consisted principally of fixed maturity securities (including residential mortgage-backed, asset-backed,
U.S. corporate and foreign corporate securities). If the on loan securities or the reinvestment portfolio become less liquid, the Company
has the liquidity resources of most of its general account available to meet any potential cash demand when securities are put back to the
Company.
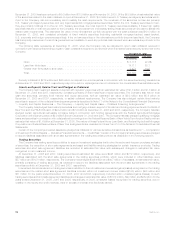
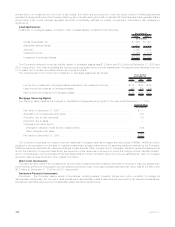
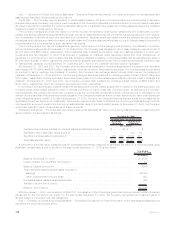
The following table represents, at December 31, 2008, when the Company may be obligated to return cash collateral received in
connection with its securities lending program. Cash collateral is required to be returned when the related loaned security is returned to the
Company.
Cash Collateral % of Total
December 31, 2008
(In millions)
Open ......................................................... $ 5,118 22.0%
Lessthanthirtydays ............................................... 14,711 63.1
Greaterthanthirtydaystosixtydays..................................... 3,471 14.9
Total . . . . . . . . . . . . . . . . . . . . . . . . . . . . . . . . . . . . . . . . . . . . . . . . . . . . . . . . . . $23,300 100.0%
Security collateral of $279 million and $40 million on deposit from counterparties in connection with the securities lending transactions
at December 31, 2008 and 2007, respectively may not be sold or repledged and is not reflected in the consolidated financial statements.
Assets on Deposit, Held in Trust and Pledged as Collateral
The Company had investment assets on deposit with regulatory agencies with an estimated fair value of $1.3 billion and $1.8 billion at
December 31, 2008 and 2007, respectively, consisting primarily of fixed maturity and equity securities. The Company also held in trust
cash and securities, primarily fixed maturity and equity securities, with an estimated fair value of $9.3 billion and $5.9 billion at
December 31, 2008 and 2007, respectively, to satisfy collateral requirements. The Company has also pledged certain fixed maturity
securities in support of the collateral financing arrangements described in Note 11 of the Notes to the Consolidated Financial Statements
“— Liquidity and Capital Resources — The Company — Liquidity and Capital Uses — Collateral Financing Arrangements.”
The Company has pledged fixed maturity securities and mortgage loans in support of its debt and funding agreements with the FHLB of
New York and the FHLB of Boston of $22.2 billion and $7.0 billion at December 31, 2008 and 2007, respectively. The Company has also
pledged certain agricultural real estate mortgage loans in connection with funding agreements with the Federal Agricultural Mortgage
Corporation with a carrying value of $2.9 billion at both December 31, 2008 and 2007. The Company has also pledged qualifying mortgage
loans and securities in connection with collateralized borrowings from the Federal Reserve Bank of New York’s Term Auction Facility with an
estimated fair value of $1.6 billion at December 31, 2008. The nature of these Federal Home Loan Bank, and Federal Agricultural Mortgage
Corporation and Federal Reserve Bank of New York arrangements are described in Notes 7 and 10 of the Notes to Consolidated Financial
Statements.
Certain of the Company’s invested assets are pledged as collateral for various derivative transactions as described in “— Composition
of Investment Portfolio Results — Derivative Financial Instruments — Credit Risk.” Certain of the Company’s trading securities are pledged
to secure liabilities associated with short sale agreements in the trading securities portfolio as described in the following section.
Trading Securities
The Company has trading securities portfolios to support investment strategies that involve the active and frequent purchase and sale
of securities, the execution of short sale agreements and asset and liability matching strategies for certain insurance products. Trading
securities and short sale agreement liabilities are recorded at estimated fair value with subsequent changes in estimated fair value
recognized in net investment income.
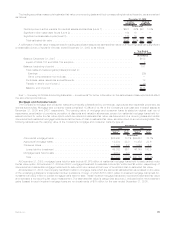
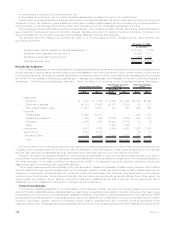
At December 31, 2008 and 2007, trading securities at estimated fair value were $946 million and $779 million, respectively, and
liabilities associated with the short sale agreements in the trading securities portfolio, which were included in other liabilities, were
$57 million and $107 million, respectively. The Company had pledged $346 million and $407 million of its assets, at estimated fair value,
primarily consisting of trading securities, as collateral to secure the liabilities associated with the short sale agreements in the trading
securities portfolio at December 31, 2008 and 2007, respectively.
Interest and dividends earned on trading securities in addition to the net realized and unrealized gains (losses) recognized on the trading
securities and the related short sale agreement liabilities included within net investment income totaled ($193) million, $50 million and
$71 million for the years ended December 31, 2008, 2007 and 2006, respectively. Included within unrealized gains (losses) on such
trading securities and short sale agreement liabilities are changes in estimated fair value of ($174) million, ($4) million and $26 million for the
years ended December 31, 2008, 2007 and 2006, respectively. In 2008, unrealized losses recognized for trading securities, due to
volatility in the equity and credit markets, were in excess of interest and dividends earned.
98 MetLife, Inc.