MetLife 2008 Annual Report Download - page 96
Download and view the complete annual report
Please find page 96 of the 2008 MetLife annual report below. You can navigate through the pages in the report by either clicking on the pages listed below, or by using the keyword search tool below to find specific information within the annual report.-
 1
1 -
2
-
3
-
4
-
5
-
6
-
7
-
8
-
9
-
10
-
11
-
12
-
13
-
14
-
15
-
16
-
17
-
18
-
19
-
20
-
21
-
22
-
23
-
24
-
25
-
26
-
27
-
28
-
29
-
30
-
31
-
32
-
33
-
34
-
35
-
36
-
37
-
38
-
39
-
40
-
41
-
42
-
43
-
44
-
45
-
46
-
47
-
48
-
49
-
50
-
51
-
52
-
53
-
54
-
55
-
56
-
57
-
58
-
59
-
60
-
61
-
62
-
63
-
64
-
65
-
66
-
67
-
68
-
69
-
70
-
71
-
72
-
73
-
74
-
75
-
76
-
77
-
78
-
79
-
80
-
81
-
82
-
83
-
84
-
85
-
 86
86 -
 87
87 -
 88
88 -
 89
89 -
 90
90 -
 91
91 -
 92
92 -
 93
93 -
 94
94 -
 95
95 -
 96
96 -
 97
97 -
 98
98 -
 99
99 -
 100
100 -
 101
101 -
 102
102 -
 103
103 -
 104
104 -
 105
105 -
 106
106 -
107
-
108
-
109
-
110
-
111
-
112
-
113
-
114
-
115
-
116
-
117
-
118
-
119
-
120
-
121
-
122
-
123
-
124
-
125
-
126
-
127
-
128
-
129
-
130
-
131
-
132
-
133
-
134
-
135
-
136
-
137
-
138
-
139
-
140
-
141
-
142
-
143
-
144
-
145
-
146
-
147
-
148
-
149
-
150
-
151
-
152
-
153
-
154
-
155
-
156
-
157
-
158
-
159
-
160
-
161
-
162
-
163
-
164
-
165
-
166
-
167
-
168
-
169
-
170
-
171
-
172
-
173
-
174
-
175
-
176
-
177
-
178
-
179
-
180
-
181
-
182
-
183
-
184
-
185
-
186
-
187
-
188
-
189
-
190
-
191
-
192
-
193
-
194
-
195
-
196
-
197
-
198
-
199
-
200
-
201
-
202
-
203
-
204
-
205
-
206
-
207
-
208
-
209
-
210
-
211
-
212
-
213
-
214
-
215
-
216
-
217
-
218
-
219
-
220
-
221
-
222
-
223
-
224
-
225
-
226
-
227
-
228
-
229
-
230
-
231
-
232
-
233
-
234
-
235
-
236
-
237
-
238
-
239
-
240
 |
 |

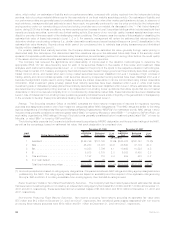
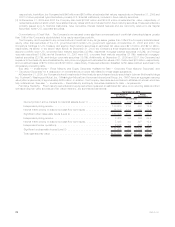
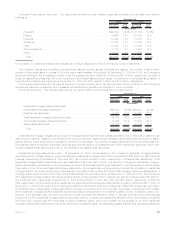
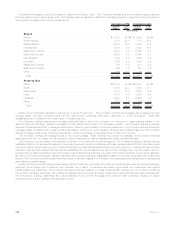
At December 31, 2008 and 2007, the Company’s gross unrealized losses related to its fixed maturity and equity securities of
$29.8 billion and $4.7 billion, respectively, were concentrated, calculated as a percentage of gross unrealized loss, as follows:
2008 2007
December 31,
Sector:
U.S.corporatesecurities .................................................... 33% 44%
Foreigncorporatesecurities................................................... 19 16
Residentialmortgage-backedsecurities........................................... 16 8
Asset-backedsecurities ..................................................... 13 11
Commercialmortgage-backedsecurities .......................................... 11 4
Stateandpoliticalsubdivisionsecurities........................................... 3 2
Foreigngovernmentsecurities ................................................. 1 4
Other ................................................................. 4 11
Total.............................................................. 100% 100%
Industry:
Mortgage-backed ......................................................... 27% 12%
Finance................................................................ 24 33
Asset-backed............................................................ 13 11
Consumer .............................................................. 11 3
Utility ................................................................. 8 8
Communication........................................................... 5 2
Industrial............................................................... 4 19
Foreigngovernment........................................................ 1 4
Other ................................................................. 7 8
Total.............................................................. 100% 100%
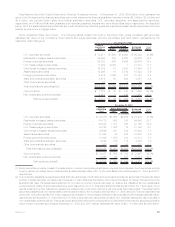
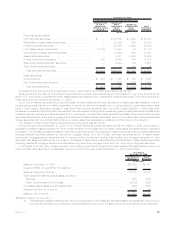
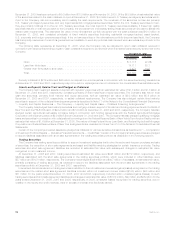
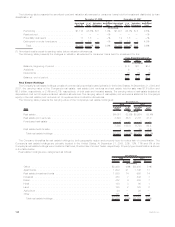
Writedowns.
The components of fixed maturity and equity securities net investment gains (losses) are as follows:
2008 2007 2006 2008 2007 2006 2008 2007 2006
Fixed Maturity Securities Equity Securities Total
(In millions)
Proceeds . . . . . . . . . . . . . . . . . . . . . . . . . $62,495 $78,001 $86,725 $2,107 $1,112 $845 $64,602 $79,113 $87,570
Gross investment gains . . . . . . . . . . . . . . . . 858 554 421 436 226 130 1,294 780 551
Gross investment losses . . . . . . . . . . . . . . . (1,511) (1,091) (1,484) (263) (43) (22) (1,774) (1,134) (1,506)
Writedowns
Credit-related . . . . . . . . . . . . . . . . . . . . . (1,138) (58) (56) (90) (19) (24) (1,228) (77) (80)
Other than credit-related(1) . . . . . . . . . . . . (158) (20) — (340) — — (498) (20) —
Total writedowns . . . . . . . . . . . . . . . . . . . (1,296) (78) (56) (430) (19) (24) (1,726) (97) (80)
Netinvestmentgains(losses) ............ $(1,949) $ (615) $ (1,119) $ (257) $ 164 $ 84 $ (2,206) $ (451) $ (1,035)
(1) Other than credit-related writedowns include items such as equity securities where the primary reason for the writedown was the severity
and/or the duration of an unrealized loss position and fixed maturity securities where an interest-rate related writedown was taken.
Overview of Fixed Maturity and Equity Security Writedowns. Writedowns of fixed maturity and equity securities were $1.7 billion,
$97 million and $80 million for the years ended December 31, 2008, 2007 and 2006, respectively. Writedowns of fixed maturity securities
were $1.3 billion, $78 million and $56 million for the years ended December 31, 2008, 2007 and 2006, respectively. Writedowns of equity
securities were $430 million, $19 million and $24 million for the years ended December 31, 2008, 2007 and 2006, respectively.
The Company’s credit-related writedowns of fixed maturity and equity securities were $1.2 billion, $77 million and $80 million for the
years ended December 31, 2008, 2007 and 2006, respectively. The Company’s credit-related writedowns of fixed maturity securities were
$1.1 billion, $58 million and $56 million for the years ended December 31, 2008, 2007 and 2006, respectively. The Company’s credit-
related writedowns of equity securities were $90 million, $19 million and $24 million for the years ended December 31, 2008, 2007 and
2006, respectively. The $90 million of credit-related equity securities writedowns in 2008 were primarily on non-redeemable preferred
securities.
The Company’s three largest impairments totaled $528 million, $19 million and $33 million for the years ended December 31, 2008,
2007 and 2006, respectively.
The Company records impairments as investment losses and adjusts the cost basis of the fixed maturity and equity securities
accordingly. The Company does not change the revised cost basis for subsequent recoveries in value.
93MetLife, Inc.