MetLife 2008 Annual Report Download - page 215
Download and view the complete annual report
Please find page 215 of the 2008 MetLife annual report below. You can navigate through the pages in the report by either clicking on the pages listed below, or by using the keyword search tool below to find specific information within the annual report.-
 1
1 -
2
-
3
-
4
-
5
-
6
-
7
-
8
-
9
-
10
-
11
-
12
-
13
-
14
-
15
-
16
-
17
-
18
-
19
-
20
-
21
-
22
-
23
-
24
-
25
-
26
-
27
-
28
-
29
-
30
-
31
-
32
-
33
-
34
-
35
-
36
-
37
-
38
-
39
-
40
-
41
-
42
-
43
-
44
-
45
-
46
-
47
-
48
-
49
-
50
-
51
-
52
-
53
-
54
-
55
-
56
-
57
-
58
-
59
-
60
-
61
-
62
-
63
-
64
-
65
-
66
-
67
-
68
-
69
-
70
-
71
-
72
-
73
-
74
-
75
-
76
-
77
-
78
-
79
-
80
-
81
-
82
-
83
-
84
-
85
-
86
-
87
-
88
-
89
-
90
-
91
-
92
-
93
-
94
-
95
-
96
-
97
-
98
-
99
-
100
-
101
-
102
-
103
-
104
-
105
-
106
-
107
-
108
-
109
-
110
-
111
-
112
-
113
-
114
-
115
-
116
-
117
-
118
-
119
-
120
-
121
-
122
-
123
-
124
-
125
-
126
-
127
-
128
-
129
-
130
-
131
-
132
-
133
-
134
-
135
-
136
-
137
-
138
-
139
-
140
-
141
-
142
-
143
-
144
-
145
-
146
-
147
-
148
-
149
-
150
-
151
-
152
-
153
-
154
-
155
-
156
-
157
-
158
-
159
-
160
-
161
-
162
-
163
-
164
-
165
-
166
-
167
-
168
-
169
-
170
-
171
-
172
-
173
-
174
-
175
-
176
-
177
-
178
-
179
-
180
-
181
-
182
-
183
-
184
-
185
-
186
-
187
-
188
-
189
-
190
-
191
-
192
-
193
-
194
-
195
-
196
-
197
-
198
-
199
-
200
-
201
-
202
-
203
-
204
-
 205
205 -
 206
206 -
 207
207 -
 208
208 -
 209
209 -
 210
210 -
 211
211 -
 212
212 -
 213
213 -
 214
214 -
 215
215 -
 216
216 -
 217
217 -
 218
218 -
 219
219 -
 220
220 -
 221
221 -
 222
222 -
 223
223 -
 224
224 -
 225
225 -
226
-
227
-
228
-
229
-
230
-
231
-
232
-
233
-
234
-
235
-
236
-
237
-
238
-
239
-
240
 |
 |

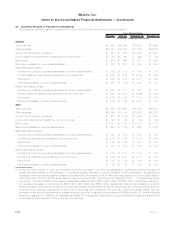
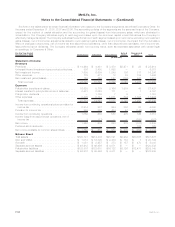
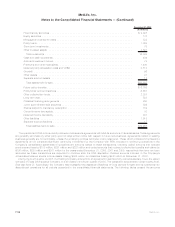
21. Quarterly Results of Operations (Unaudited)
The unaudited quarterly results of operations for 2008 and 2007 are summarized in the table below:
March 31, June 30, September 30, December 31,
Three Months Ended
(In millions, except per share data)
2008(1)
Totalrevenues ............................................. $11,626 $12,048 $13,353 $13,962
Totalexpenses............................................. $10,788 $10,824 $11,763 $12,524
Incomefromcontinuingoperations................................ $ 628 $ 883 $ 1,058 $ 941
Income (loss) from discontinued operations, net of income tax . . . . . . . . . . . . . . $ 20 $ 63 $ (428) $ 44
Netincome............................................... $ 648 $ 946 $ 630 $ 985
Netincomeavailabletocommonshareholders ........................ $ 615 $ 915 $ 600 $ 954
Basic earnings per share:
Income from continuing operations available to common shareholders . . . . . . . . $ 0.82 $ 1.19 $ 1.44 $ 1.15
Income (loss) from discontinued operations, net of income tax . . . . . . . . . . . . . $ 0.03 $ 0.09 $ (0.60) $ 0.06
Netincome.............................................. $ 0.90 $ 1.33 $ 0.88 $ 1.25
Netincomeavailabletocommonshareholders....................... $ 0.85 $ 1.28 $ 0.84 $ 1.21
Diluted earnings per share:
Income from continuing operations available to common shareholders . . . . . . . . $ 0.81 $ 1.17 $ 1.42 $ 1.14
Income (loss) from discontinued operations, net of income tax . . . . . . . . . . . . . $ 0.03 $ 0.09 $ (0.59) $ 0.06
Netincome.............................................. $ 0.88 $ 1.30 $ 0.88 $ 1.25
Netincomeavailabletocommonshareholders....................... $ 0.84 $ 1.26 $ 0.83 $ 1.20
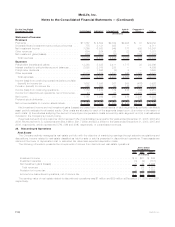
2007
Totalrevenues ............................................. $11,505 $11,699 $11,646 $12,308
Totalexpenses............................................. $10,149 $10,141 $10,328 $10,778
Incomefromcontinuingoperations................................ $ 970 $ 1,109 $ 940 $ 1,083
Incomefromdiscontinuedoperations,netofincometax.................. $ 47 $ 54 $ 79 $ 35
Netincome............................................... $ 1,017 $ 1,163 $ 1,019 $ 1,118
Netincomeavailabletocommonshareholders ........................ $ 983 $ 1,129 $ 985 $ 1,083
Basic earnings per share:
Income from continuing operations available to common shareholders . . . . . . . . $ 1.24 $ 1.44 $ 1.22 $ 1.42
Income from discontinued operations, net of income tax . . . . . . . . . . . . . . . . . $ 0.07 $ 0.08 $ 0.10 $ 0.05
Netincome.............................................. $ 1.35 $ 1.56 $ 1.37 $ 1.52
Netincomeavailabletocommonshareholders....................... $ 1.31 $ 1.52 $ 1.32 $ 1.47
Diluted earnings per share:
Income from continuing operations available to common shareholders . . . . . . . . $ 1.22 $ 1.41 $ 1.19 $ 1.39
Income from discontinued operations, net of income tax . . . . . . . . . . . . . . . . . $ 0.06 $ 0.07 $ 0.10 $ 0.05
Netincome.............................................. $ 1.32 $ 1.52 $ 1.34 $ 1.48
Netincomeavailabletocommonshareholders....................... $ 1.28 $ 1.48 $ 1.29 $ 1.44
(1) During the fourth quarter of 2008, the Company recorded a cumulative out-of-period adjustment in connection with the exclusion of
certain derivative gains from the estimation of cumulative gross profits used in the determination of DAC amortization. The adjustment
decreased deferred policy acquisition costs and increased DAC amortization by $124 million and decreased net income by $80 million in
the fourth quarter of 2008. Had the amounts been reflected during the first, second and third quarters of 2008 — in the periods in which
they arose — DAC amortization would have increased (decreased) by $100 million, ($61) million, and $85 million, respectively, resulting in
an increase (decrease) of net income by ($65) million, $40 million and ($55) million, respectively. Net income available to common
shareholders per diluted common share would have been higher (lower) by ($0.09), $0.06, ($0.08) and $0.10 during the first, second,
third and fourth quarters, respectively, of 2008 had the amounts been reflected in the periods in which they arose. Based upon an
evaluation of all relevant quantitative and qualitative factors, and after considering the provisions of APB Opinion No. 28, Interim Financial
Reporting, paragraph 29, SAB No. 99, Materiality, and SAB 108, management believes this correcting adjustment was not material to the
Company’s full year results for 2008 or the trend of earnings.
F-92 MetLife, Inc.
MetLife, Inc.
Notes to the Consolidated Financial Statements — (Continued)