MetLife 2008 Annual Report Download - page 79
Download and view the complete annual report
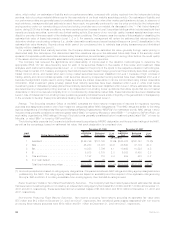
Please find page 79 of the 2008 MetLife annual report below. You can navigate through the pages in the report by either clicking on the pages listed below, or by using the keyword search tool below to find specific information within the annual report.
The Subsidiaries recognized no other postretirement benefit expense in 2008 as compared to $8 million in 2007 and $58 million in
2006. The major components of net periodic other postretirement benefit plan cost described above were as follows:
2008 2007 2006
Years Ended December 31,
(In millions)
Servicecost...................................................... $ 21 $ 27 $ 35
Interestcost...................................................... 103 103 116
Expectedreturnonplanassets.......................................... (86) (86) (79)
Amortizationofnetactuarial(gains)losses................................... (1) — 22
Amortizationofpriorservicecost(credit).................................... (37) (36) (36)
Netperiodicbenefitcost ............................................ $ — $ 8 $ 58
The decrease in benefit cost from 2006 to 2007 primarily resulted from a change in the Medicare integration methodology for certain
retirees. The decrease in benefit cost from 2007 to 2008 was due to primarily to increases in the discount rate and better than expected
medical trend experience.
For 2009 postretirement benefit expense, we anticipate an increase of approximately $25 million due to poor plan asset performance as
a result of the economic downturn of the financial markets. The expected increase in expense can be attributed to lower expected return on
assets and increased amortization of net actuarial losses.
The estimated net actuarial losses and prior service credit for the other postretirement benefit plans that will be amortized from
accumulated other comprehensive income (loss) into net periodic benefit cost over the next year are less than $10 million and ($36) million,
respectively.
The weighted average discount rate used to calculate the net periodic postretirement cost was 6.65%, 6.00% and 5.82% for the years
ended December 31, 2008, 2007 and 2006, respectively.
The weighted average expected rate of return on plan assets used to calculate the net other postretirement benefit plan cost for the
years ended December 31, 2008, 2007 and 2006 was 7.33%, 7.47% and 7.42%, respectively. The expected rate of return on plan assets
is based on anticipated performance of the various asset sectors in which the plan invests, weighted by target allocation percentages.
Anticipated future performance is based on long-term historical returns of the plan assets by sector, adjusted for the Subsidiaries’ long-
term expectations on the performance of the markets. While the precise expected return derived using this approach will fluctuate from
year to year, the Subsidiaries’ policy is to hold this long-term assumption constant as long as it remains within reasonable tolerance from
the derived rate.
Based on the December 31, 2008 asset balances, a 25 basis point increase (decrease) in the expected rate of return on plan assets
would result in a decrease (increase) in net periodic benefit cost of $3 million for the other postretirement benefit plans.
Funding and Cash Flows of Pension and Other Postretirement Benefit Plan Obligations
Pension Plan Obligations
It is the Subsidiaries’ practice to make contributions to the qualified pension plans to comply with minimum funding requirements of
ERISA, as amended. In accordance with such practice, no contributions were required for the years ended December 31, 2008 or 2007.
No contributions will be required for 2009. The Subsidiaries made a discretionary contribution of $300 million to the qualified pension plans
during the year ended December 31, 2008. During the year ended December 31, 2007, the Subsidiaries did not make any discretionary
contributions to the qualified pension plans. The Subsidiaries expect to make additional discretionary contributions of $150 million in 2009.
Benefit payments due under the non-qualified pension plans are funded from the Subsidiaries’ general assets as they become due
under the provision of the plans. These payments totaled $43 million and $48 million for the years ended December 31, 2008 and 2007,
respectively. These benefit payments are expected to be at approximately the same level in 2009.
Gross pension benefit payments for the next ten years, which reflect expected future service as appropriate, are expected to be as
follows: Pension
Benefits
(In millions)
2009. . . . . . . . . . . . . . . . . . . . . . . . . . . . . . . . . . . . . . . . . . . . . . . . . . . . . . . . . . . . . . . . . . . . $ 384
2010. . . . . . . . . . . . . . . . . . . . . . . . . . . . . . . . . . . . . . . . . . . . . . . . . . . . . . . . . . . . . . . . . . . . $ 398
2011. . . . . . . . . . . . . . . . . . . . . . . . . . . . . . . . . . . . . . . . . . . . . . . . . . . . . . . . . . . . . . . . . . . . $ 408
2012. . . . . . . . . . . . . . . . . . . . . . . . . . . . . . . . . . . . . . . . . . . . . . . . . . . . . . . . . . . . . . . . . . . . $ 424
2013. . . . . . . . . . . . . . . . . . . . . . . . . . . . . . . . . . . . . . . . . . . . . . . . . . . . . . . . . . . . . . . . . . . . $ 437
2014-2018 . . . . . . . . . . . . . . . . . . . . . . . . . . . . . . . . . . . . . . . . . . . . . . . . . . . . . . . . . . . . . . . . $2,416
Other Postretirement Benefit Plan Obligations
Other postretirement benefits represent a non-vested, non-guaranteed obligation of the Subsidiaries and current regulations do not
require specific funding levels for these benefits. While the Subsidiaries have partially funded such plans in advance, it has been the
Subsidiaries’ practice to primarily use their general assets, net of participants’ contributions, to pay postretirement medical claims as they
come due in lieu of utilizing plan assets. Total payments equaled $149 million and $173 million for the years ended December 31, 2008 and
2007, respectively.
The Subsidiaries’ expect to make contributions of $120 million, net of participants’ contributions, towards the other postretirement plan
obligations in 2009. As noted previously, the Subsidiaries expect to receive subsidies under the Prescription Drug Act to partially offset
such payments.
76 MetLife, Inc.


