MetLife 2008 Annual Report Download - page 232
Download and view the complete annual report
Please find page 232 of the 2008 MetLife annual report below. You can navigate through the pages in the report by either clicking on the pages listed below, or by using the keyword search tool below to find specific information within the annual report.-
 1
1 -
2
-
3
-
4
-
5
-
6
-
7
-
8
-
9
-
10
-
11
-
12
-
13
-
14
-
15
-
16
-
17
-
18
-
19
-
20
-
21
-
22
-
23
-
24
-
25
-
26
-
27
-
28
-
29
-
30
-
31
-
32
-
33
-
34
-
35
-
36
-
37
-
38
-
39
-
40
-
41
-
42
-
43
-
44
-
45
-
46
-
47
-
48
-
49
-
50
-
51
-
52
-
53
-
54
-
55
-
56
-
57
-
58
-
59
-
60
-
61
-
62
-
63
-
64
-
65
-
66
-
67
-
68
-
69
-
70
-
71
-
72
-
73
-
74
-
75
-
76
-
77
-
78
-
79
-
80
-
81
-
82
-
83
-
84
-
85
-
86
-
87
-
88
-
89
-
90
-
91
-
92
-
93
-
94
-
95
-
96
-
97
-
98
-
99
-
100
-
101
-
102
-
103
-
104
-
105
-
106
-
107
-
108
-
109
-
110
-
111
-
112
-
113
-
114
-
115
-
116
-
117
-
118
-
119
-
120
-
121
-
122
-
123
-
124
-
125
-
126
-
127
-
128
-
129
-
130
-
131
-
132
-
133
-
134
-
135
-
136
-
137
-
138
-
139
-
140
-
141
-
142
-
143
-
144
-
145
-
146
-
147
-
148
-
149
-
150
-
151
-
152
-
153
-
154
-
155
-
156
-
157
-
158
-
159
-
160
-
161
-
162
-
163
-
164
-
165
-
166
-
167
-
168
-
169
-
170
-
171
-
172
-
173
-
174
-
175
-
176
-
177
-
178
-
179
-
180
-
181
-
182
-
183
-
184
-
185
-
186
-
187
-
188
-
189
-
190
-
191
-
192
-
193
-
194
-
195
-
196
-
197
-
198
-
199
-
200
-
201
-
202
-
203
-
204
-
205
-
206
-
207
-
208
-
209
-
210
-
211
-
212
-
213
-
214
-
215
-
216
-
217
-
218
-
219
-
220
-
221
-
 222
222 -
 223
223 -
 224
224 -
 225
225 -
 226
226 -
 227
227 -
 228
228 -
 229
229 -
 230
230 -
 231
231 -
 232
232 -
 233
233 -
 234
234 -
 235
235 -
 236
236 -
 237
237 -
 238
238 -
 239
239 -
 240
240
 |
 |

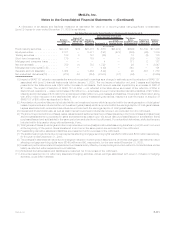
Assets and Liabilities Measured at Fair Value
Recurring Fair Value Measurements
The assets and liabilities measured at estimated fair value on a recurring basis, including those items for which the Company has
elected the fair value option, are determined as described in the preceding section. These estimated fair values and their corresponding
fair value hierarchy are summarized as follows:
Quoted Prices in
Active Markets for
Identical Assets
and Liabilities
(Level 1)
Significant
Other
Observable
Inputs
(Level 2)
Significant
Unobservable
Inputs
(Level 3)
Total
Estimated
Fair Value
Fair Value Measurements at
Reporting Date Using
December 31, 2008
(In millions)
Assets
Fixed maturity securities:
U.S.corporatesecurities...................................... $ — $ 55,805 $ 7,498 $ 63,303
Residentialmortgage-backedsecurities ............................ — 35,433 595 36,028
Foreigncorporatesecurities.................................... — 23,735 5,944 29,679
U.S.Treasury/agencysecurities ................................. 10,132 11,090 88 21,310
Commercialmortgage-backedsecurities ........................... — 12,384 260 12,644
Asset-backedsecurities ...................................... — 8,071 2,452 10,523
Foreigngovernmentsecurities .................................. 282 9,463 408 10,153
Stateandpoliticalsubdivisionsecurities............................ — 4,434 123 4,557
Otherfixedmaturitysecurities................................... — 14 40 54
Total fixed maturity securities . . . . . . . . . . . . . . . . . . . . . . . . . . . . . . . . . . 10,414 160,429 17,408 188,251
Equity securities:
Commonstock............................................ 413 1,167 105 1,685
Non-redeemablepreferredstock................................. — 238 1,274 1,512
Totalequitysecurities ...................................... 413 1,405 1,379 3,197
Tradingsecurities........................................... 587 184 175 946
Short-terminvestments(1) ..................................... 10,549 2,913 100 13,562
Mortgageandconsumerloans(2) ................................ — 1,798 177 1,975
Derivativeassets(3) ......................................... 55 9,483 2,768 12,306
Netembeddedderivativeswithinassethostcontracts(4) ................. — — 205 205
Mortgageservicingrights(5).................................... — — 191 191
Separateaccountassets(6).................................... 85,886 33,195 1,758 120,839
Totalassets............................................. $107,904 $209,407 $24,161 $341,472
Liabilities
Derivativeliabilities(3) ........................................ $ 273 $ 3,548 $ 221 $ 4,042
Net embedded derivatives within liability host contracts(4) . . . . . . . . . . . . . . . . — (83) 3,134 3,051
Tradingliabilities(7).......................................... 57 — — 57
Totalliabilities............................................ $ 330 $ 3,465 $ 3,355 $ 7,150
(1) Short-term investments as presented in the table above differ from the amounts presented in the consolidated balance sheet because
certain short-term investments are not measured at estimated fair value (e.g. time deposits, money market funds, etc.).
(2) Mortgage and consumer loans as presented in the table above differ from the amount presented in the consolidated balance sheet as this
table only includes residential mortgage loans held-for-sale measured at estimated fair value on a recurring basis.
(3) Derivative assets are presented within other invested assets and derivatives liabilities are presented within other liabilities. The amounts
are presented gross in the table above to reflect the presentation in the consolidated balance sheet, but are presented net for purposes of
the rollforward in the following tables.
(4) Net embedded derivatives within asset host contracts are presented within premiums and other receivables. Net embedded derivatives
within liability host contracts are presented within policyholder account balances. Equity securities also includes embedded derivatives of
($173) million.
(5) Mortgage servicing rights are presented within other invested assets.
(6) Separate account assets are measured at estimated fair value. Investment performance related to separate account assets is fully offset
by corresponding amounts credited to contractholders whose liability is reflected within separate account liabilities. Separate account
liabilities are set equal to the estimated fair value of separate account assets as prescribed by SOP 03-1.
(7) Trading liabilities are presented within other liabilities.
F-109MetLife, Inc.
MetLife, Inc.
Notes to the Consolidated Financial Statements — (Continued)