MetLife 2008 Annual Report Download - page 86
Download and view the complete annual report
Please find page 86 of the 2008 MetLife annual report below. You can navigate through the pages in the report by either clicking on the pages listed below, or by using the keyword search tool below to find specific information within the annual report.-
 1
1 -
2
-
3
-
4
-
5
-
6
-
7
-
8
-
9
-
10
-
11
-
12
-
13
-
14
-
15
-
16
-
17
-
18
-
19
-
20
-
21
-
22
-
23
-
24
-
25
-
26
-
27
-
28
-
29
-
30
-
31
-
32
-
33
-
34
-
35
-
36
-
37
-
38
-
39
-
40
-
41
-
42
-
43
-
44
-
45
-
46
-
47
-
48
-
49
-
50
-
51
-
52
-
53
-
54
-
55
-
56
-
57
-
58
-
59
-
60
-
61
-
62
-
63
-
64
-
65
-
66
-
67
-
68
-
69
-
70
-
71
-
72
-
73
-
74
-
75
-
 76
76 -
 77
77 -
 78
78 -
 79
79 -
 80
80 -
 81
81 -
 82
82 -
 83
83 -
 84
84 -
 85
85 -
 86
86 -
 87
87 -
 88
88 -
 89
89 -
 90
90 -
 91
91 -
 92
92 -
 93
93 -
 94
94 -
 95
95 -
 96
96 -
97
-
98
-
99
-
100
-
101
-
102
-
103
-
104
-
105
-
106
-
107
-
108
-
109
-
110
-
111
-
112
-
113
-
114
-
115
-
116
-
117
-
118
-
119
-
120
-
121
-
122
-
123
-
124
-
125
-
126
-
127
-
128
-
129
-
130
-
131
-
132
-
133
-
134
-
135
-
136
-
137
-
138
-
139
-
140
-
141
-
142
-
143
-
144
-
145
-
146
-
147
-
148
-
149
-
150
-
151
-
152
-
153
-
154
-
155
-
156
-
157
-
158
-
159
-
160
-
161
-
162
-
163
-
164
-
165
-
166
-
167
-
168
-
169
-
170
-
171
-
172
-
173
-
174
-
175
-
176
-
177
-
178
-
179
-
180
-
181
-
182
-
183
-
184
-
185
-
186
-
187
-
188
-
189
-
190
-
191
-
192
-
193
-
194
-
195
-
196
-
197
-
198
-
199
-
200
-
201
-
202
-
203
-
204
-
205
-
206
-
207
-
208
-
209
-
210
-
211
-
212
-
213
-
214
-
215
-
216
-
217
-
218
-
219
-
220
-
221
-
222
-
223
-
224
-
225
-
226
-
227
-
228
-
229
-
230
-
231
-
232
-
233
-
234
-
235
-
236
-
237
-
238
-
239
-
240
 |
 |

and dividend rates for policies that permit such adjustments. The Company also uses certain derivative instruments in the management of
credit and interest rate risks.
Current Environment. Concerns over the availability and cost of credit, the U.S. mortgage market, geopolitical issues, energy costs,
inflation and a declining real estate market in the United States have contributed to increased volatility and diminished expectations for the
economy and the financial markets going forward. These factors, combined with declining business and consumer confidence and
increased unemployment, have precipitated an economic slowdown and with the National Bureau of Economic Research having
announced in the 4th quarter of 2008 an ongoing U.S. recession that began in December 2007. As a result of the stress experienced
by the global financial markets, the fixed-income markets are experiencing a period of extreme volatility which has negatively impacted
market liquidity conditions. Initially, the concerns on the part of market participants were focused on the sub-prime segment of the
mortgage-backed securities market. However, these concerns have since expanded to include a broad range of mortgage-backed and
asset-backed and other fixed income securities, including those rated investment grade, the U.S. and international credit and inter-bank
money markets generally, and a wide range of financial institutions and markets, asset classes and sectors. Securities that are less liquid
are more difficult to value and have fewer opportunities for disposal.
As a result of this unprecedented disruption and market dislocation, we have experienced both volatility in the valuation of certain
investments and decreased liquidity in certain asset classes and, as such, have experienced an increase in certain Level 3 investments. As
demonstrated in “- Fixed Maturity Securities — Available for Sale — Fair Value Hierarchy,” during 2008 we have experienced an increase in
certain Level 3 investments which include less liquid fixed maturity securities and equity securities with very limited trading activity. Even
some of our very high quality assets have been more illiquid for periods of time as a result of the recent challenging market conditions.
These market conditions have also lead to an increase in unrealized losses on fixed maturity and equity securities in 2008, particularly for
residential and commercial mortgage-backed, asset-backed and corporate fixed maturity securities; and within the Company’s financial
services industry fixed maturity and equity securities holdings.
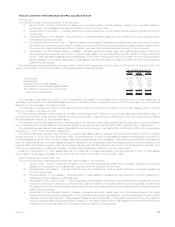
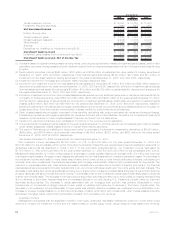
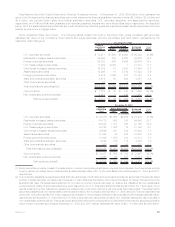
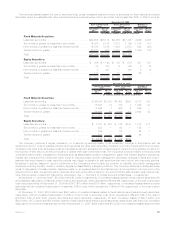
Composition of Investment Portfolio Results
The following table illustrates the net investment income, net investment gains (losses), annualized yields on average ending assets and
ending carrying value for each of the components of the Company’s investment portfolio at:
2008 2007 2006
December 31,
(In millions)
Fixed Maturity Securities
Yield(1).................................................. 6.40% 6.42% 6.23%
Investmentincome(2) ........................................ $ 12,403 $ 12,425 $ 11,623
Investmentgains(losses)...................................... $ (1,949) $ (615) $ (1,119)
Endingcarryingvalue(2)....................................... $189,197 $233,115 $233,514
Mortgage and Consumer Loans
Yield(1).................................................. 6.08% 6.56% 6.60%
Investmentincome(3) ........................................ $ 2,774 $ 2,648 $ 2,365
Investmentgains(losses)...................................... $ (136) $ 3 $ (8)
Endingcarryingvalue ........................................ $ 51,364 $ 46,154 $ 41,457
Real Estate and Real Estate Joint Ventures(4)
Yield(1).................................................. 2.98% 10.29% 11.43%
Investmentincome .......................................... $ 217 $ 607 $ 550
Investmentgains(losses)...................................... $ (10) $ 59 $ 4,897
Endingcarryingvalue ........................................ $ 7,586 $ 6,767 $ 4,981
Policy Loans
Yield(1).................................................. 6.22% 6.21% 6.02%
Investmentincome .......................................... $ 601 $ 572 $ 547
Endingcarryingvalue ........................................ $ 9,802 $ 9,326 $ 9,178
Equity Securities(7)
Yield(1).................................................. 5.25% 5.14% 3.56%
Investmentincome .......................................... $ 249 $ 244 $ 106
Investmentgains(losses)...................................... $ (257) $ 164 $ 84
Endingcarryingvalue ........................................ $ 3,197 $ 5,911 $ 4,929
Other Limited Partnership Interests(7)
Yield(1).................................................. (2.77)% 27.09% 22.42%
Investmentincome(loss) ...................................... $ (170) $ 1,309 $ 945
Investmentgains(losses)...................................... $ (140) $ 16 $ 1
Endingcarryingvalue ........................................ $ 6,039 $ 6,155 $ 4,781
Cash and Short-Term Investments
Yield(1).................................................. 1.62% 4.91% 5.68%
Investmentincome .......................................... $ 307 $ 424 $ 437
Investmentgains(losses)...................................... $ 3 $ 3 $ (2)
Endingcarryingvalue ........................................ $ 38,085 $ 12,505 $ 9,472
Other Invested Assets(5)(6)(8)
Investmentincome .......................................... $ 383 $ 526 $ 447
Investmentgains(losses)...................................... $ 4,260 $ (474) $ (736)
Endingcarryingvalue ........................................ $ 17,248 $ 8,076 $ 6,524
Total Investments
Grossinvestmentincomeyield(1)................................. 5.71% 6.88% 6.65%
Investmentfeesandexpensesyield............................... (0.16)% (0.16)% (0.15)%
Net Investment Income Yield ................................. 5.55% 6.72% 6.50%
83MetLife, Inc.