MetLife 2008 Annual Report Download - page 108
Download and view the complete annual report
Please find page 108 of the 2008 MetLife annual report below. You can navigate through the pages in the report by either clicking on the pages listed below, or by using the keyword search tool below to find specific information within the annual report.-
 1
1 -
2
-
3
-
4
-
5
-
6
-
7
-
8
-
9
-
10
-
11
-
12
-
13
-
14
-
15
-
16
-
17
-
18
-
19
-
20
-
21
-
22
-
23
-
24
-
25
-
26
-
27
-
28
-
29
-
30
-
31
-
32
-
33
-
34
-
35
-
36
-
37
-
38
-
39
-
40
-
41
-
42
-
43
-
44
-
45
-
46
-
47
-
48
-
49
-
50
-
51
-
52
-
53
-
54
-
55
-
56
-
57
-
58
-
59
-
60
-
61
-
62
-
63
-
64
-
65
-
66
-
67
-
68
-
69
-
70
-
71
-
72
-
73
-
74
-
75
-
76
-
77
-
78
-
79
-
80
-
81
-
82
-
83
-
84
-
85
-
86
-
87
-
88
-
89
-
90
-
91
-
92
-
93
-
94
-
95
-
96
-
97
-
 98
98 -
 99
99 -
 100
100 -
 101
101 -
 102
102 -
 103
103 -
 104
104 -
 105
105 -
 106
106 -
 107
107 -
 108
108 -
 109
109 -
 110
110 -
 111
111 -
 112
112 -
 113
113 -
 114
114 -
 115
115 -
 116
116 -
 117
117 -
 118
118 -
119
-
120
-
121
-
122
-
123
-
124
-
125
-
126
-
127
-
128
-
129
-
130
-
131
-
132
-
133
-
134
-
135
-
136
-
137
-
138
-
139
-
140
-
141
-
142
-
143
-
144
-
145
-
146
-
147
-
148
-
149
-
150
-
151
-
152
-
153
-
154
-
155
-
156
-
157
-
158
-
159
-
160
-
161
-
162
-
163
-
164
-
165
-
166
-
167
-
168
-
169
-
170
-
171
-
172
-
173
-
174
-
175
-
176
-
177
-
178
-
179
-
180
-
181
-
182
-
183
-
184
-
185
-
186
-
187
-
188
-
189
-
190
-
191
-
192
-
193
-
194
-
195
-
196
-
197
-
198
-
199
-
200
-
201
-
202
-
203
-
204
-
205
-
206
-
207
-
208
-
209
-
210
-
211
-
212
-
213
-
214
-
215
-
216
-
217
-
218
-
219
-
220
-
221
-
222
-
223
-
224
-
225
-
226
-
227
-
228
-
229
-
230
-
231
-
232
-
233
-
234
-
235
-
236
-
237
-
238
-
239
-
240
 |
 |

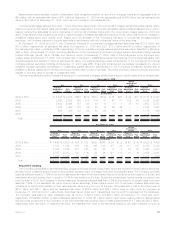
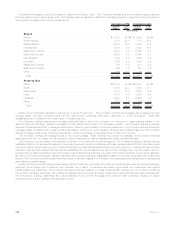
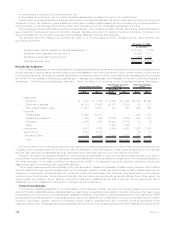
The following table presents the notional amount and current market or estimated fair value of derivative financial instruments, excluding
embedded derivatives, held at:
Notional
Amount Assets Liabilities Notional
Amount Assets Liabilities
Current Market
or Fair Value Current Market
or Fair Value
December 31, 2008 December 31, 2007
(In millions)
Interest rate swaps . . . . . . . . . . . . . . . . . . . . . $ 34,060 $ 4,617 $1,468 $ 62,410 $ 784 $ 768
Interestratefloors ..................... 48,517 1,748 — 48,937 621 —
Interestratecaps...................... 24,643 11 — 45,498 50 —
Financialfutures....................... 19,908 45 205 12,302 89 57
Foreign currency swaps . . . . . . . . . . . . . . . . . . 19,438 1,953 1,866 21,201 1,480 1,719
Foreign currency forwards . . . . . . . . . . . . . . . . 5,167 153 129 4,177 76 16
Options ............................ 8,450 3,162 35 6,565 713 1
Financialforwards ..................... 28,176 465 169 11,937 122 2
Credit default swaps . . . . . . . . . . . . . . . . . . . . 5,219 152 69 6,625 58 33
SyntheticGICs ....................... 4,260 — — 3,670 — —
Other.............................. 250 — 101 250 43 —
Total .............................. $198,088 $12,306 $4,042 $223,572 $4,036 $2,596
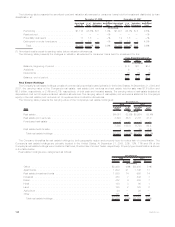
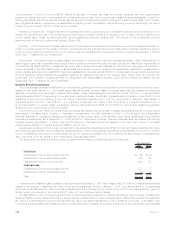
Fair Value Hierarchy. Derivatives measured at estimated fair value on a recurring basis and their corresponding fair value hierarchy, are
summarized as follows:
Derivative
Assets Derivative
Liabilities
December 31, 2008
(In millions)
Quoted prices in active markets for identical assets and liabilities (Level 1) . . . $ 55 —% 273 7%
Significantotherobservableinputs(Level2) ........................ 9,483 77 3,548 88
Significantunobservableinputs(Level3)........................... 2,768 23 221 5
Totalestimatedfairvalue ..................................... $12,306 100% $4,042 100%
The valuation of Level 3 derivatives involves the use of significant unobservable inputs and generally requires a higher degree of
management judgment or estimation than the valuations of Level 1 and Level 2 derivatives. Although Level 3 inputs are based on
assumptions deemed appropriate given the circumstances and are consistent with what other market participants would use when pricing
such instruments, the use of different inputs or methodologies could have a material effect on the estimated fair value of Level 3 derivatives
and could materially affect net income.
Derivatives categorized as Level 3 at December 31, 2008 include: financial forwards including swap spread locks with maturities which
extend beyond observable periods; interest rate lock commitments with certain unobservable inputs, including pull-through rates; equity
variance swaps with unobservable volatility inputs or that are priced via independent broker quotations; foreign currency swaps which are
cancelable and priced through independent broker quotations; interest rate swaps with maturities which extend beyond the observable
portion of the yield curve; credit default swaps based upon baskets of credits having unobservable credit correlations as well as credit
default swaps with maturities which extend beyond the observable portion of the credit curves and credit default swaps priced through
independent broker quotes; foreign currency forwards priced via independent broker quotations or with liquidity adjustments; equity
options with unobservable volatility inputs; and interest rate caps and floors referencing unobservable yield curves and/or which include
liquidity and volatility adjustments.
At December 31, 2008 and 2007, 2.7% and 1.5% of the net derivative estimated fair value was priced via independent broker
quotations.
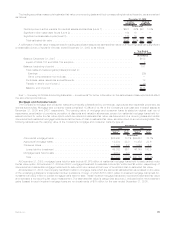
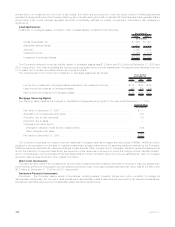
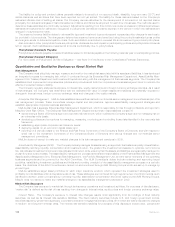
A rollforward of the fair value measurements for derivatives measured at estimated fair value on a recurring basis using significant
unobservable (Level 3) inputs for the year ended December 31, 2008 is as follows:
Year Ended
December 31, 2008
(In millions)
Balance, December 31, 2007 . . . . . . . . . . . . . . . . . . . . . . . . . . . . . . . . . . . . . . . . . . . . . . . $ 789
ImpactofSFAS157andSFAS159adoption...................................... (1)
Balance,beginningofperiod................................................ 788
Total realized/unrealized gains (losses) included in:
Earnings............................................................ 1,729
Othercomprehensiveincome(loss) .......................................... —
Purchases,sales,issuancesandsettlements ..................................... 29
Transferinand/oroutofLevel3.............................................. 1
Balance,endofperiod.................................................... $2,547
105MetLife, Inc.