MetLife 2008 Annual Report Download - page 235
Download and view the complete annual report
Please find page 235 of the 2008 MetLife annual report below. You can navigate through the pages in the report by either clicking on the pages listed below, or by using the keyword search tool below to find specific information within the annual report.-
 1
1 -
2
-
3
-
4
-
5
-
6
-
7
-
8
-
9
-
10
-
11
-
12
-
13
-
14
-
15
-
16
-
17
-
18
-
19
-
20
-
21
-
22
-
23
-
24
-
25
-
26
-
27
-
28
-
29
-
30
-
31
-
32
-
33
-
34
-
35
-
36
-
37
-
38
-
39
-
40
-
41
-
42
-
43
-
44
-
45
-
46
-
47
-
48
-
49
-
50
-
51
-
52
-
53
-
54
-
55
-
56
-
57
-
58
-
59
-
60
-
61
-
62
-
63
-
64
-
65
-
66
-
67
-
68
-
69
-
70
-
71
-
72
-
73
-
74
-
75
-
76
-
77
-
78
-
79
-
80
-
81
-
82
-
83
-
84
-
85
-
86
-
87
-
88
-
89
-
90
-
91
-
92
-
93
-
94
-
95
-
96
-
97
-
98
-
99
-
100
-
101
-
102
-
103
-
104
-
105
-
106
-
107
-
108
-
109
-
110
-
111
-
112
-
113
-
114
-
115
-
116
-
117
-
118
-
119
-
120
-
121
-
122
-
123
-
124
-
125
-
126
-
127
-
128
-
129
-
130
-
131
-
132
-
133
-
134
-
135
-
136
-
137
-
138
-
139
-
140
-
141
-
142
-
143
-
144
-
145
-
146
-
147
-
148
-
149
-
150
-
151
-
152
-
153
-
154
-
155
-
156
-
157
-
158
-
159
-
160
-
161
-
162
-
163
-
164
-
165
-
166
-
167
-
168
-
169
-
170
-
171
-
172
-
173
-
174
-
175
-
176
-
177
-
178
-
179
-
180
-
181
-
182
-
183
-
184
-
185
-
186
-
187
-
188
-
189
-
190
-
191
-
192
-
193
-
194
-
195
-
196
-
197
-
198
-
199
-
200
-
201
-
202
-
203
-
204
-
205
-
206
-
207
-
208
-
209
-
210
-
211
-
212
-
213
-
214
-
215
-
216
-
217
-
218
-
219
-
220
-
221
-
222
-
223
-
224
-
 225
225 -
 226
226 -
 227
227 -
 228
228 -
 229
229 -
 230
230 -
 231
231 -
 232
232 -
 233
233 -
 234
234 -
 235
235 -
 236
236 -
 237
237 -
 238
238 -
 239
239 -
 240
240
 |
 |

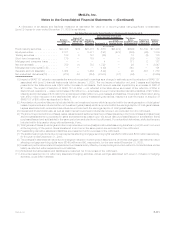
The table below summarizes both realized and unrealized gains and losses for the year ended December 31, 2008 due to changes in
estimated fair value recorded in earnings for Level 3 assets and liabilities:
Net
Investment
Income
Net
Investment
Gains (Losses) Other
Revenues
Policyholder
Benefits and
Claims Total
Classification of Realized/Unrealized Gains
(Losses) included in Earnings
Total Gains and Losses
(In millions)
Fixedmaturitysecurities ..................... $176 $(1,057) $ — $ — $ (881)
Equitysecurities .......................... — (197) — — (197)
Tradingsecurities ......................... (26) — — — (26)
Short-terminvestments...................... 1 (1) — — —
Mortgageandconsumerloans................. — — 4 — 4
Netderivatives ........................... 103 1,587 39 — 1,729
Mortgageservicingrights .................... — — (149) — (149)
Netembeddedderivatives.................... — (2,682) — 182 (2,500)
The table below summarizes the portion of unrealized gains and losses recorded in earnings for the year ended December 31, 2008 for
Level 3 assets and liabilities that are still held at December 31, 2008.
Net
Investment
Income
Net
Investment
Gains (Losses) Other
Revenues
Policyholder
Benefits and
Claims Total
Changes in Unrealized Gains (Losses)
Relating to Assets and Liabilities Held at December 31, 2008
(In millions)
Fixedmaturitysecurities ..................... $163 $ (793) $ — $ — $ (630)
Equitysecurities .......................... — (164) — — (164)
Tradingsecurities ......................... (17) — — — (17)
Short-terminvestments...................... — — — — —
Mortgageandconsumerloans................. — — 3 — 3
Netderivatives ........................... 114 1,504 38 — 1,656
Mortgageservicingrights .................... — — (150) — (150)
Netembeddedderivatives.................... — (2,779) — 182 (2,597)
Fair Value Option — Mortgage and Consumer Loans
The Company has elected fair value accounting for certain residential mortgage loans held-for-sale. At December 31, 2008, the
estimated fair value carrying amount of $1,975 million is greater than the aggregate unpaid principal amount of $1,920 million by
$55 million. None of the loans where the fair value option has been elected are more than 90 days past due or in non-accrual status at
December 31, 2008.
Residential mortgage loans held-for-sale accounted for under SFAS 159 are initially measured at estimated fair value. Gains and losses
from initial measurement, subsequent changes in estimated fair value, and gains or losses on sales are recognized in other revenues.
Interest income on residential mortgage loans held-for-sale is recorded based on the stated rate of the loan and is recorded in net
investment income.
Changesinestimatedfairvalueof$55millionhavebeenincludedinthestatementofincomeforresidentialmortgageloansheld-for-
sale for the year ended December 31, 2008.
Changes in estimated fair value due to instrument-specific credit risk are estimated based on changes in credit spreads for non-agency
loans and adjustments in individual loan quality, of which there were none for the year ended December 31, 2008.
Non-Recurring Fair Value Measurements
At December 31, 2008, the Company held $220 million in mortgage loans which are carried at estimated fair value based on
independent broker quotations or, if the loans were in foreclosure or are otherwise determined to be collateral dependent, on the value of
the underlying collateral of which $188 million was related to impaired mortgage loans held-for-investment and $32 million to certain
mortgage loans held-for-sale. These impaired mortgage loans were recorded at estimated fair value and represent a nonrecurring fair value
measurement. The estimated fair value was categorized as Level 3. Included within net investment gains (losses) for such impaired
mortgage loans are net impairments of $79 million for the year ended December 31, 2008.
At December 31, 2008, the Company held $137 million in cost basis other limited partnership interests which were impaired during the
year ended December 31, 2008 based on the underlying limited partnership financial statements. These other limited partnership interests
were recorded at estimated fair value and represent a nonrecurring fair value measurement. The estimated fair value was categorized as
Level 3. Included within net investment gains (losses) for such other limited partnerships are impairments of $105 million for the year ended
December 31, 2008.
F-112 MetLife, Inc.
MetLife, Inc.
Notes to the Consolidated Financial Statements — (Continued)