MetLife 2008 Annual Report Download - page 165
Download and view the complete annual report
Please find page 165 of the 2008 MetLife annual report below. You can navigate through the pages in the report by either clicking on the pages listed below, or by using the keyword search tool below to find specific information within the annual report.-
 1
1 -
2
-
3
-
4
-
5
-
6
-
7
-
8
-
9
-
10
-
11
-
12
-
13
-
14
-
15
-
16
-
17
-
18
-
19
-
20
-
21
-
22
-
23
-
24
-
25
-
26
-
27
-
28
-
29
-
30
-
31
-
32
-
33
-
34
-
35
-
36
-
37
-
38
-
39
-
40
-
41
-
42
-
43
-
44
-
45
-
46
-
47
-
48
-
49
-
50
-
51
-
52
-
53
-
54
-
55
-
56
-
57
-
58
-
59
-
60
-
61
-
62
-
63
-
64
-
65
-
66
-
67
-
68
-
69
-
70
-
71
-
72
-
73
-
74
-
75
-
76
-
77
-
78
-
79
-
80
-
81
-
82
-
83
-
84
-
85
-
86
-
87
-
88
-
89
-
90
-
91
-
92
-
93
-
94
-
95
-
96
-
97
-
98
-
99
-
100
-
101
-
102
-
103
-
104
-
105
-
106
-
107
-
108
-
109
-
110
-
111
-
112
-
113
-
114
-
115
-
116
-
117
-
118
-
119
-
120
-
121
-
122
-
123
-
124
-
125
-
126
-
127
-
128
-
129
-
130
-
131
-
132
-
133
-
134
-
135
-
136
-
137
-
138
-
139
-
140
-
141
-
142
-
143
-
144
-
145
-
146
-
147
-
148
-
149
-
150
-
151
-
152
-
153
-
154
-
 155
155 -
 156
156 -
 157
157 -
 158
158 -
 159
159 -
 160
160 -
 161
161 -
 162
162 -
 163
163 -
 164
164 -
 165
165 -
 166
166 -
 167
167 -
 168
168 -
 169
169 -
 170
170 -
 171
171 -
 172
172 -
 173
173 -
 174
174 -
 175
175 -
176
-
177
-
178
-
179
-
180
-
181
-
182
-
183
-
184
-
185
-
186
-
187
-
188
-
189
-
190
-
191
-
192
-
193
-
194
-
195
-
196
-
197
-
198
-
199
-
200
-
201
-
202
-
203
-
204
-
205
-
206
-
207
-
208
-
209
-
210
-
211
-
212
-
213
-
214
-
215
-
216
-
217
-
218
-
219
-
220
-
221
-
222
-
223
-
224
-
225
-
226
-
227
-
228
-
229
-
230
-
231
-
232
-
233
-
234
-
235
-
236
-
237
-
238
-
239
-
240
 |
 |

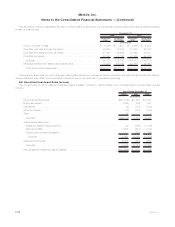
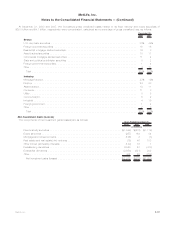
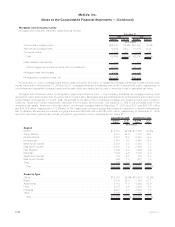
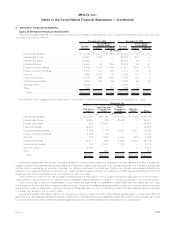
Real estate holdings were categorized as follows:
Amount Percent Amount Percent
2008 2007
December 31,
(In millions)
Office ................................................. $3,489 46% $3,480 51%
Apartments.............................................. 1,602 21 1,148 17
Realestateinvestmentfunds .................................. 1,080 14 950 14
Industrial ............................................... 483 7 443 7
Retail.................................................. 472 6 455 7
Hotel.................................................. 180 3 60 1
Land.................................................. 155 2 125 2
Agriculture .............................................. 24 — 29 —
Other.................................................. 101 1 77 1
Totalrealestateholdings.................................... $7,586 100% $6,767 100%
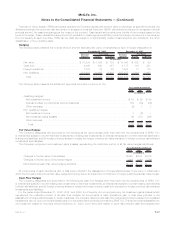
Other Limited Partnership Interests
The carrying value of other limited partnership interests (which primarily represent ownership interests in pooled investment funds that
principally make private equity investments in companies in the United States and overseas) was $6.0 billion and $6.2 billion at
December 31, 2008 and 2007, respectively. Included within other limited partnership interests at December 31, 2008 and 2007 are
$1.3 billion and $1.6 billion, respectively, of hedge funds.
For the years ended December 31, 2008, 2007 and 2006, net investment income (loss) from other limited partnership interests was
($170) million, $1,309 million and $945 million, respectively. Net investment income (loss) from other limited partnership interests, including
hedge funds, decreased by $1,479 million for the year ended 2008, due to volatility in the equity and credit markets.
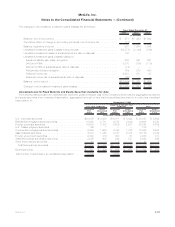
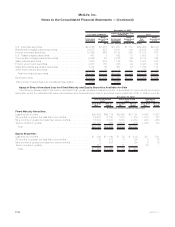
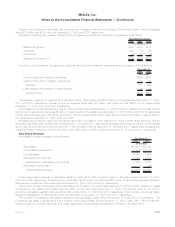
Other Invested Assets
The following table presents the carrying value of the Company’s other invested assets at:
Type Carrying
Value %of
Total Carrying
Value %of
Total
2008 2007
December 31,
(In millions)
Freestandingderivativeswithpositivefairvalues...................... $12,306 71.3% $4,036 50.0%
Leveragedleases,netofnon-recoursedebt ........................ 2,146 12.4 2,059 25.5
Jointventureinvestments..................................... 751 4.4 622 7.7
Taxcreditpartnerships ...................................... 503 2.9 — —
Fundingagreements........................................ 394 2.3 383 4.7
Mortgageservicingrights..................................... 191 1.1 — —
Fundswithheld ........................................... 62 0.4 80 1.0
Other.................................................. 895 5.2 896 11.1
Total . . . . . . . . . . . . . . . . . . . . . . . . . . . . . . . . . . . . . . . . . . . . . . . . . . $17,248 100.0% $8,076 100.0%
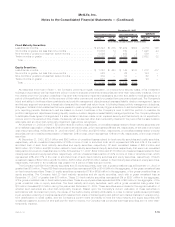
SeeNote4regardingthefreestandingderivativeswithpositiveestimated fair values. Joint venture investments are accounted for on
the equity method and represent our investment in insurance underwriting joint ventures in Japan, Chile and China. Tax credit partnerships
are established for the purpose of investing in low-income housing and other social causes, where the primary return on investment is in
the form of tax credits, and are accounted for under the equity method. Funding agreements represent arrangements where the Company
has long-term interest bearing amounts on deposit with third parties and are generally stated at amortized cost. Funds withheld represent
amounts contractually withheld by ceding companies in accordance with reinsurance agreements.
F-42 MetLife, Inc.
MetLife, Inc.
Notes to the Consolidated Financial Statements — (Continued)