MetLife 2010 Annual Report Download - page 96
Download and view the complete annual report
Please find page 96 of the 2010 MetLife annual report below. You can navigate through the pages in the report by either clicking on the pages listed below, or by using the keyword search tool below to find specific information within the annual report.-
 1
1 -
2
-
3
-
4
-
5
-
6
-
7
-
8
-
9
-
10
-
11
-
12
-
13
-
14
-
15
-
16
-
17
-
18
-
19
-
20
-
21
-
22
-
23
-
24
-
25
-
26
-
27
-
28
-
29
-
30
-
31
-
32
-
33
-
34
-
35
-
36
-
37
-
38
-
39
-
40
-
41
-
42
-
43
-
44
-
45
-
46
-
47
-
48
-
49
-
50
-
51
-
52
-
53
-
54
-
55
-
56
-
57
-
58
-
59
-
60
-
61
-
62
-
63
-
64
-
65
-
66
-
67
-
68
-
69
-
70
-
71
-
72
-
73
-
74
-
75
-
76
-
77
-
78
-
79
-
80
-
81
-
82
-
83
-
84
-
85
-
 86
86 -
 87
87 -
 88
88 -
 89
89 -
 90
90 -
 91
91 -
 92
92 -
 93
93 -
 94
94 -
 95
95 -
 96
96 -
 97
97 -
 98
98 -
 99
99 -
 100
100 -
 101
101 -
 102
102 -
 103
103 -
 104
104 -
 105
105 -
 106
106 -
107
-
108
-
109
-
110
-
111
-
112
-
113
-
114
-
115
-
116
-
117
-
118
-
119
-
120
-
121
-
122
-
123
-
124
-
125
-
126
-
127
-
128
-
129
-
130
-
131
-
132
-
133
-
134
-
135
-
136
-
137
-
138
-
139
-
140
-
141
-
142
-
143
-
144
-
145
-
146
-
147
-
148
-
149
-
150
-
151
-
152
-
153
-
154
-
155
-
156
-
157
-
158
-
159
-
160
-
161
-
162
-
163
-
164
-
165
-
166
-
167
-
168
-
169
-
170
-
171
-
172
-
173
-
174
-
175
-
176
-
177
-
178
-
179
-
180
-
181
-
182
-
183
-
184
-
185
-
186
-
187
-
188
-
189
-
190
-
191
-
192
-
193
-
194
-
195
-
196
-
197
-
198
-
199
-
200
-
201
-
202
-
203
-
204
-
205
-
206
-
207
-
208
-
209
-
210
-
211
-
212
-
213
-
214
-
215
-
216
-
217
-
218
-
219
-
220
-
221
-
222
-
223
-
224
-
225
-
226
-
227
-
228
-
229
-
230
-
231
-
232
-
233
-
234
-
235
-
236
-
237
-
238
-
239
-
240
-
241
-
242
 |
 |

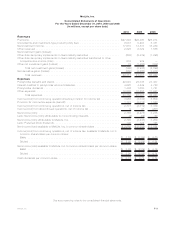
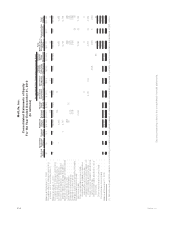
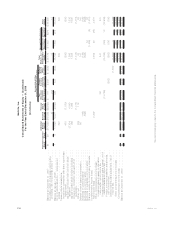
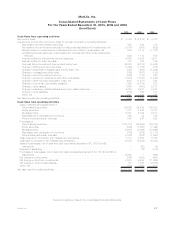
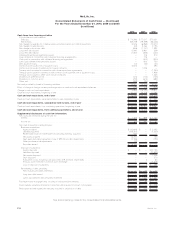
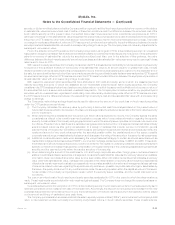
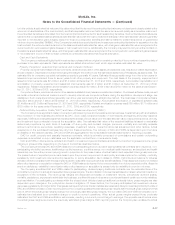
MetLife, Inc.
Consolidated Statements of Cash Flows
For the Years Ended December 31, 2010, 2009 and 2008
(In millions)
2010 2009 2008
Cash flows from operating activities
Netincome(loss) ..................................................... $ 2,786 $ (2,278) $ 3,278
Adjustments to reconcile net income (loss) to net cash provided by operating activities:
Depreciationandamortizationexpenses ................................... 585 520 375
Amortization of premiums and accretion of discounts associated with investments, net . . . . . (1,078) (967) (939)
(Gains) losses on investments and derivatives and from sales of businesses, net . . . . . . . . . 854 7,715 (1,127)
Undistributed equity earnings of real estate joint ventures and other limited partnership
interests....................................................... (430) 1,118 679
Interestcreditedtopolicyholderaccountbalances............................. 4,925 4,852 4,911
Interestcreditedtobankdeposits........................................ 137 163 166
Universallifeandinvestment-typeproductpolicyfees........................... (6,037) (5,218) (5,462)
Changeintradingandothersecurities..................................... (1,369) (1,152) (418)
Changeinresidentialmortgageloansheld-for-sale,net.......................... (487) (800) (1,946)
Changeinmortgageservicingrights...................................... (165) (687) (185)
Changeinaccruedinvestmentincome .................................... (206) (110) 428
Changeinpremiums,reinsuranceandotherreceivables ......................... (1,023) (1,653) (1,929)
Changeindeferredpolicyacquisitioncosts,net .............................. (541) (1,837) 545
Changeinincometaxrecoverable(payable)................................. 1,292 (2,614) 920
Changeinotherassets .............................................. 1,948 (660) 5,737
Changeininsurance-relatedliabilitiesandpolicy-relatedbalances................... 6,489 6,401 5,307
Changeinotherliabilities ............................................. (315) 865 163
Other,net ....................................................... 631 145 199
Netcashprovidedbyoperatingactivities...................................... 7,996 3,803 10,702
Cash flows from investing activities
Sales, maturities and repayments of:
Fixedmaturitysecurities.............................................. 86,529 64,428 102,250
Equitysecurities................................................... 1,371 2,545 2,707
Mortgageloans.................................................... 6,361 5,769 6,077
Realestateandrealestatejointventures................................... 322 43 140
Otherlimitedpartnershipinterests........................................ 522 947 593
Purchases of:
Fixed maturity securities . . . . . . . . . . . . . . . . . . . . . . . . . . . . . . . . . . . . . . . . . . . . . . (100,713) (83,940) (86,874)
Equitysecurities................................................... (949) (1,986) (1,494)
Mortgageloans.................................................... (8,967) (4,692) (10,096)
Realestateandrealestatejointventures................................... (786) (579) (1,170)
Otherlimitedpartnershipinterests........................................ (1,008) (803) (1,643)
Cashreceivedinconnectionwithfreestandingderivatives ......................... 1,814 3,292 8,168
Cashpaidinconnectionwithfreestandingderivatives ............................ (2,548) (5,393) (6,454)
Sales of businesses, net of cash and cash equivalents disposed of $0, $180 and $0,
respectively...................................................... — (50) (4)
Disposalofsubsidiary................................................. — (19) (313)
Purchases of businesses, net of cash and cash equivalents acquired of $4,175, $0 and $314,
respectively...................................................... (3,021) — (469)
Netchangeinpolicyloans.............................................. (225) (259) (467)
Netchangeinshort-terminvestments ...................................... 3,033 5,534 (11,269)
Netchangeinotherinvestedassets ....................................... 137 1,388 (2,206)
Other,net......................................................... (186) (160) (147)
Netcashusedininvestingactivities ......................................... $ (18,314) $(13,935) $ (2,671)
See accompanying notes to the consolidated financial statements.
F-7MetLife, Inc.