MetLife 2010 Annual Report Download - page 215
Download and view the complete annual report
Please find page 215 of the 2010 MetLife annual report below. You can navigate through the pages in the report by either clicking on the pages listed below, or by using the keyword search tool below to find specific information within the annual report.-
 1
1 -
2
-
3
-
4
-
5
-
6
-
7
-
8
-
9
-
10
-
11
-
12
-
13
-
14
-
15
-
16
-
17
-
18
-
19
-
20
-
21
-
22
-
23
-
24
-
25
-
26
-
27
-
28
-
29
-
30
-
31
-
32
-
33
-
34
-
35
-
36
-
37
-
38
-
39
-
40
-
41
-
42
-
43
-
44
-
45
-
46
-
47
-
48
-
49
-
50
-
51
-
52
-
53
-
54
-
55
-
56
-
57
-
58
-
59
-
60
-
61
-
62
-
63
-
64
-
65
-
66
-
67
-
68
-
69
-
70
-
71
-
72
-
73
-
74
-
75
-
76
-
77
-
78
-
79
-
80
-
81
-
82
-
83
-
84
-
85
-
86
-
87
-
88
-
89
-
90
-
91
-
92
-
93
-
94
-
95
-
96
-
97
-
98
-
99
-
100
-
101
-
102
-
103
-
104
-
105
-
106
-
107
-
108
-
109
-
110
-
111
-
112
-
113
-
114
-
115
-
116
-
117
-
118
-
119
-
120
-
121
-
122
-
123
-
124
-
125
-
126
-
127
-
128
-
129
-
130
-
131
-
132
-
133
-
134
-
135
-
136
-
137
-
138
-
139
-
140
-
141
-
142
-
143
-
144
-
145
-
146
-
147
-
148
-
149
-
150
-
151
-
152
-
153
-
154
-
155
-
156
-
157
-
158
-
159
-
160
-
161
-
162
-
163
-
164
-
165
-
166
-
167
-
168
-
169
-
170
-
171
-
172
-
173
-
174
-
175
-
176
-
177
-
178
-
179
-
180
-
181
-
182
-
183
-
184
-
185
-
186
-
187
-
188
-
189
-
190
-
191
-
192
-
193
-
194
-
195
-
196
-
197
-
198
-
199
-
200
-
201
-
202
-
203
-
204
-
 205
205 -
 206
206 -
 207
207 -
 208
208 -
 209
209 -
 210
210 -
 211
211 -
 212
212 -
 213
213 -
 214
214 -
 215
215 -
 216
216 -
 217
217 -
 218
218 -
 219
219 -
 220
220 -
 221
221 -
 222
222 -
 223
223 -
 224
224 -
 225
225 -
226
-
227
-
228
-
229
-
230
-
231
-
232
-
233
-
234
-
235
-
236
-
237
-
238
-
239
-
240
-
241
-
242
 |
 |

Quoted
Prices
In Active
Markets
for
Identical
Assets
(Level 1)
Significant
Other
Observable
Inputs
(Level 2)
Significant
Unobservable
Inputs
(Level 3)
Total
Estimated
Fair
Value
Quoted
Prices
In Active
Markets
for
Identical
Assets
(Level 1)
Significant
Other
Observable
Inputs
(Level 2)
Significant
Unobservable
Inputs
(Level 3)
Total
Estimated
Fair
Value
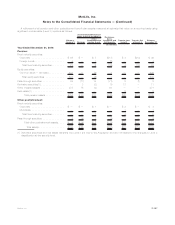
Fair Value Measurements at
Reporting Date Using Fair Value Measurements at
Reporting Date Using
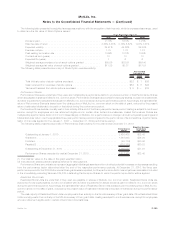
Pension Benefits Other Postretirement Benefits
December 31, 2009
(In millions)
Assets
Fixed maturity securities:
Corporate .................... $ — $1,458 $ 68 $1,526 $ — $ 48 $— $ 48
Federalagencies ............... (41) 140 — 99 — 30 — 30
Foreignbonds ................. 1 195 5 201 — 6 — 6
Municipals.................... — 56 — 56 — 21 — 21
Preferredstocks................ — 2 — 2 — — — —
U.S. government bonds . . . . . . . . . . . 319 50 — 369 45 — — 45
U.S.treasurynotes.............. — — — — 12 — — 12
Total fixed maturity securities . . . . . . 279 1,901 73 2,253 57 105 — 162
Equity securities:
Common stock — domestic . . . . . . . . 1,565 238 241 2,044 342 6 — 348
Commonstock—foreign.......... 393 — — 393 72 — — 72
Total equity securities . . . . . . . . . . . 1,958 238 241 2,437 414 6 — 420
Moneymarketsecurities ............ 72 56 — 128 12 1 — 13
Pass-throughsecurities............. 1 376 69 446 — 75 9 84
Derivativesecurities ............... 3 — — 3 — — — —
Short-term investments . . . . . . . . . . . . . 2 115 — 117 — 442 — 442
Otherinvestedassets.............. 13 — 373 386 — — — —
Total assets . . . . . . . . . . . . . . . . $2,328 $2,686 $756 $5,770 $483 $629 $ 9 $1,121
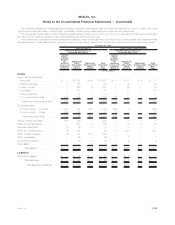
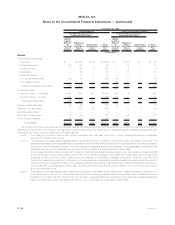
The pension and other postretirement benefit plan assets are categorized into the three-level fair value hierarchy, as defined in Note 1,
based upon the priority of the inputs to the respective valuation technique. The following summarizes the types of assets included within the
three-level fair value hierarchy presented in the table above.
Level 1 This category includes investments in liquid securities, such as cash, short-term money market and bank time deposits,
expected to mature within a year.
Level 2 This category includes certain separate accounts that are primarily invested in liquid and readily marketable securities. The
estimated fair value of such separate account is based upon reported NAV provided by fund managers and this value represents
the amount at which transfers into and out of the respective separate account are effected. These separate accounts provide
reasonable levels of price transparency and can be corroborated through observable market data.
Certain separate accounts are invested in investment partnerships designated as hedge funds. The values for these separate
accounts is determined monthly based on the NAV of the underlying hedge fund investment. Additionally, such hedge funds
generally contain lock out or other waiting period provisions for redemption requests to be filled. While the reporting and
redemption restrictions may limit the frequency of trading activity in separate accounts invested in hedge funds, the reported
NAV, and thus the referenced value of the separate account, provides a reasonable level of price transparency that can be
corroborated through observable market data. Directly held investments are primarily invested in U.S. and foreign government
and corporate securities.
Level 3 This category includes separate accounts that are invested in real estate and private equity investments that provide little or no
price transparency due to the infrequency with which the underlying assets trade and generally require additional time to
liquidate in an orderly manner. Accordingly, the values for separate accounts invested in these alternative asset classes are
based on inputs that cannot be readily derived from or corroborated by observable market data.
F-126 MetLife, Inc.
MetLife, Inc.
Notes to the Consolidated Financial Statements — (Continued)