MetLife 2010 Annual Report Download - page 140
Download and view the complete annual report
Please find page 140 of the 2010 MetLife annual report below. You can navigate through the pages in the report by either clicking on the pages listed below, or by using the keyword search tool below to find specific information within the annual report.-
 1
1 -
2
-
3
-
4
-
5
-
6
-
7
-
8
-
9
-
10
-
11
-
12
-
13
-
14
-
15
-
16
-
17
-
18
-
19
-
20
-
21
-
22
-
23
-
24
-
25
-
26
-
27
-
28
-
29
-
30
-
31
-
32
-
33
-
34
-
35
-
36
-
37
-
38
-
39
-
40
-
41
-
42
-
43
-
44
-
45
-
46
-
47
-
48
-
49
-
50
-
51
-
52
-
53
-
54
-
55
-
56
-
57
-
58
-
59
-
60
-
61
-
62
-
63
-
64
-
65
-
66
-
67
-
68
-
69
-
70
-
71
-
72
-
73
-
74
-
75
-
76
-
77
-
78
-
79
-
80
-
81
-
82
-
83
-
84
-
85
-
86
-
87
-
88
-
89
-
90
-
91
-
92
-
93
-
94
-
95
-
96
-
97
-
98
-
99
-
100
-
101
-
102
-
103
-
104
-
105
-
106
-
107
-
108
-
109
-
110
-
111
-
112
-
113
-
114
-
115
-
116
-
117
-
118
-
119
-
120
-
121
-
122
-
123
-
124
-
125
-
126
-
127
-
128
-
129
-
 130
130 -
 131
131 -
 132
132 -
 133
133 -
 134
134 -
 135
135 -
 136
136 -
 137
137 -
 138
138 -
 139
139 -
 140
140 -
 141
141 -
 142
142 -
 143
143 -
 144
144 -
 145
145 -
 146
146 -
 147
147 -
 148
148 -
 149
149 -
 150
150 -
151
-
152
-
153
-
154
-
155
-
156
-
157
-
158
-
159
-
160
-
161
-
162
-
163
-
164
-
165
-
166
-
167
-
168
-
169
-
170
-
171
-
172
-
173
-
174
-
175
-
176
-
177
-
178
-
179
-
180
-
181
-
182
-
183
-
184
-
185
-
186
-
187
-
188
-
189
-
190
-
191
-
192
-
193
-
194
-
195
-
196
-
197
-
198
-
199
-
200
-
201
-
202
-
203
-
204
-
205
-
206
-
207
-
208
-
209
-
210
-
211
-
212
-
213
-
214
-
215
-
216
-
217
-
218
-
219
-
220
-
221
-
222
-
223
-
224
-
225
-
226
-
227
-
228
-
229
-
230
-
231
-
232
-
233
-
234
-
235
-
236
-
237
-
238
-
239
-
240
-
241
-
242
 |
 |

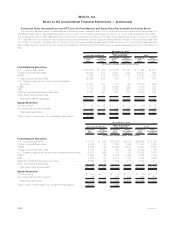
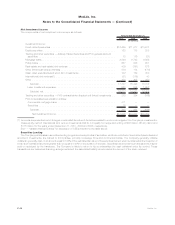
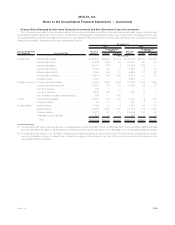
Mortgage Loans
Mortgage loans are summarized as follows at:
Carrying
Value %of
Total Carrying
Value %of
Total
2010 2009
December 31,
(In millions)
Mortgage loans held-for-investment:
Commercialmortgageloans................................. $37,820 60.7% $35,176 69.0%
Agriculturalmortgageloans ................................. 12,751 20.4 12,255 24.1
Residentialmortgageloans ................................. 2,308 3.7 1,471 2.9
Subtotal ............................................ 52,879 84.8 48,902 96.0
Valuationallowances ..................................... (664) (1.1) (721) (1.4)
Subtotal mortgage loans held-for-investment, net . . . . . . . . . . . . . . . . . . 52,215 83.7 48,181 94.6
Commercial mortgage loans held by consolidated securitization entities —
FVO............................................... 6,840 11.0 — —
Totalmortgageloansheld-for-investment,net.................... 59,055 94.7 48,181 94.6
Mortgage loans held-for-sale:
Residentialmortgageloans—FVO ............................ 2,510 4.0 2,470 4.9
Mortgage loans — lower of amortized cost or estimated fair value(1) . . . . . . . 811 1.3 258 0.5
Totalmortgageloansheld-for-sale .............................. 3,321 5.3 2,728 5.4
Total mortgage loans, net . . . . . . . . . . . . . . . . . . . . . . . . . . . . . . . . . . . . $62,376 100.0% $50,909 100.0%
(1) Includes agricultural and residential mortgage loans.
See “— Variable Interest Entities” for discussion of CSEs included in the table above.
Concentration of Credit Risk — The Company diversifies its mortgage loan portfolio by both geographic region and property type to
reduce the risk of concentration. The Company’s commercial and agricultural mortgage loans are collateralized by properties primarily
located in the United States, at 91%, with the remaining 9% collateralized by properties located outside the United States, calculated as a
percent of total mortgage loans held-for-investment (excluding commercial mortgage loans held by CSEs) at December 31, 2010. The
carrying value of the Company’s commercial and agricultural mortgage loans located in California, New York and Texas were 21%, 8% and
7%, respectively, of total mortgage loans held-for-investment (excluding commercial mortgage loans held by CSEs) at December 31, 2010.
Additionally, the Company manages risk when originating commercial and agricultural mortgage loans by generally lending only up to 75% of
the estimated fair value of the underlying real estate.
Certain of the Company’s real estate joint ventures have mortgage loans with the Company. The carrying values of such mortgage loans
were $283 million and $368 million at December 31, 2010 and 2009, respectively.
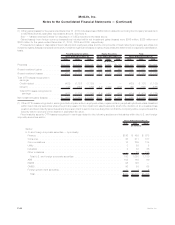
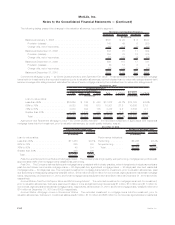
The following tables present the recorded investment in mortgage loans held-for-investment, by portfolio segment, by method of
evaluation of credit loss, and the related valuation allowances, by type of credit loss, at:
2010 2009 2010 2009 2010 2009 2010 2009
Commercial Agricultural Residential Total
December 31,
(In millions)
Mortgage loans:
Evaluated individually for credit losses . . . . . $ 120 $ 102 $ 146 $ 211 $ 15 $ 3 $ 281 $ 316
Evaluated collectively for credit losses . . . . . 37,700 35,074 12,605 12,044 2,293 1,468 52,598 48,586
Total mortgage loans . . . . . . . . . . . . . . 37,820 35,176 12,751 12,255 2,308 1,471 52,879 48,902
Valuation allowances:
Specific credit losses . . . . . . . . . . . . . . . 36 41 52 82 — — 88 123
Non-specifically identified credit losses . . . . 526 548 36 33 14 17 576 598
Total valuation allowances . . . . . . . . . . . 562 589 88 115 14 17 664 721
Mortgage loans, net of valuation allowance . . . $37,258 $34,587 $12,663 $12,140 $2,294 $1,454 $52,215 $48,181
F-51MetLife, Inc.
MetLife, Inc.
Notes to the Consolidated Financial Statements — (Continued)