MetLife 2010 Annual Report Download - page 30
Download and view the complete annual report
Please find page 30 of the 2010 MetLife annual report below. You can navigate through the pages in the report by either clicking on the pages listed below, or by using the keyword search tool below to find specific information within the annual report.-
 1
1 -
2
-
3
-
4
-
5
-
6
-
7
-
8
-
9
-
10
-
11
-
12
-
13
-
14
-
15
-
16
-
17
-
18
-
19
-
 20
20 -
 21
21 -
 22
22 -
 23
23 -
 24
24 -
 25
25 -
 26
26 -
 27
27 -
 28
28 -
 29
29 -
 30
30 -
 31
31 -
 32
32 -
 33
33 -
 34
34 -
 35
35 -
 36
36 -
 37
37 -
 38
38 -
 39
39 -
 40
40 -
41
-
42
-
43
-
44
-
45
-
46
-
47
-
48
-
49
-
50
-
51
-
52
-
53
-
54
-
55
-
56
-
57
-
58
-
59
-
60
-
61
-
62
-
63
-
64
-
65
-
66
-
67
-
68
-
69
-
70
-
71
-
72
-
73
-
74
-
75
-
76
-
77
-
78
-
79
-
80
-
81
-
82
-
83
-
84
-
85
-
86
-
87
-
88
-
89
-
90
-
91
-
92
-
93
-
94
-
95
-
96
-
97
-
98
-
99
-
100
-
101
-
102
-
103
-
104
-
105
-
106
-
107
-
108
-
109
-
110
-
111
-
112
-
113
-
114
-
115
-
116
-
117
-
118
-
119
-
120
-
121
-
122
-
123
-
124
-
125
-
126
-
127
-
128
-
129
-
130
-
131
-
132
-
133
-
134
-
135
-
136
-
137
-
138
-
139
-
140
-
141
-
142
-
143
-
144
-
145
-
146
-
147
-
148
-
149
-
150
-
151
-
152
-
153
-
154
-
155
-
156
-
157
-
158
-
159
-
160
-
161
-
162
-
163
-
164
-
165
-
166
-
167
-
168
-
169
-
170
-
171
-
172
-
173
-
174
-
175
-
176
-
177
-
178
-
179
-
180
-
181
-
182
-
183
-
184
-
185
-
186
-
187
-
188
-
189
-
190
-
191
-
192
-
193
-
194
-
195
-
196
-
197
-
198
-
199
-
200
-
201
-
202
-
203
-
204
-
205
-
206
-
207
-
208
-
209
-
210
-
211
-
212
-
213
-
214
-
215
-
216
-
217
-
218
-
219
-
220
-
221
-
222
-
223
-
224
-
225
-
226
-
227
-
228
-
229
-
230
-
231
-
232
-
233
-
234
-
235
-
236
-
237
-
238
-
239
-
240
-
241
-
242
 |
 |

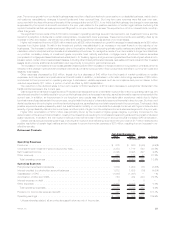
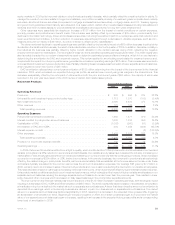
contributing $23 million to the improvement in operating earnings. India’s results benefited by $10 million primarily due to lower expenses
resulting from the loss of a major distributor and slower growth resulting from market conditions.
Partially offsetting these increases is the impact of pesification in Argentina, which favorably impacted 2009 reported earnings by
$95 million. This prior period benefit was due to a liability release resulting from a reassessment of our approach in managing existing and
potential future claims related to certain social security pension annuity contractholders in Argentina. In addition, operating earnings in
Australia were lower by $9 million, which was primarily due to a write-off of DAC attributable to a change in a product feature in the current
period.
In addition to a $133 million increase due to the inclusion of ALICO results, net investment income increased $102 million from growth in
average invested assets and $88 million from improved yields. Growth in average invested assets reflects growth in our businesses. Improved
yields reflects the impact of increased inflation, primarily in Chile, as well as the impact of changes in assumptions for measuring the effects of
inflation on certain inflation-indexed fixed maturity securities. The increase in net investment income from higher inflation was offset by an
increase in the related insurance liabilities due to higher inflation. Although diversification into higher yielding investments had a positive
impact on yields, this was partially offset by decreased trading and other securities results driven by a stronger recovery in equity markets in
2009 compared to 2010, primarily in Hong Kong, and by a decrease in the results of our operating joint ventures. The reduction in net
investment income from our trading portfolio is entirely offset by a corresponding decrease in the interest credited on the related
contractholder account balances and therefore had no impact on operating earnings.
In addition to a $269 million increase associated with the Acquisition, operating expenses increased due to the impact of the pesification in
Argentina noted above, as well as current period business growth in South Korea, Brazil and Mexico, which resulted in $93 million of
increased commissions and compensation. These increases were partially offset by $33 million of lower commissions and business
expenses in India.
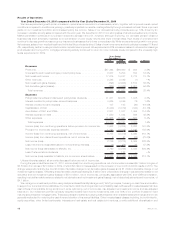
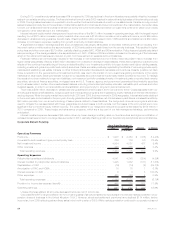
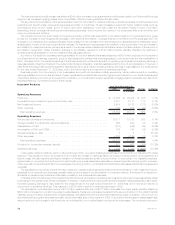
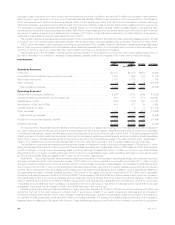
Banking, Corporate & Other
2010 2009 Change % Change
Years Ended December 31,
(In millions)
Operating Revenues
Premiums .................................................... $ 11 $ 19 $ (8) (42.1)%
Netinvestmentincome............................................ 992 477 515 108.0%
Otherrevenues................................................. 1,044 1,092 (48) (4.4)%
Totaloperatingrevenues ......................................... 2,047 1,588 459 28.9%
Operating Expenses
Policyholderbenefitsanddividends.................................... (14) 4 (18) (450.0)%
Interestcreditedtobankdeposits..................................... 137 163 (26) (16.0)%
AmortizationofDACandVOBA ...................................... 1 3 (2) (66.7)%
Interestexpenseondebt .......................................... 1,126 1,027 99 9.6%
Otherexpenses ................................................ 1,155 1,336 (181) (13.5)%
Totaloperatingexpenses......................................... 2,405 2,533 (128) (5.1)%
Provisionforincometaxexpense(benefit) ............................... (300) (617) 317 51.4%
Operatingearnings .............................................. (58) (328) 270 82.3%
Less:Preferredstockdividends...................................... 122 122 — —%
Operatingearningsavailabletocommonshareholders ....................... $ (180) $ (450) $270 60.0%
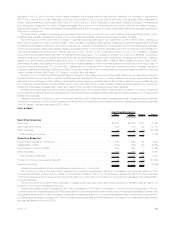
Unless otherwise stated, all amounts discussed below are net of income tax.
During 2010, mortgage refinancing activity continued to return to more moderate levels compared to the unusually high levels experienced
in 2009. Consistent with these market conditions, we experienced a $15.2 billion decline in residential mortgage production during 2010,
while our serviced residential mortgage loans increased $20.1 billion, which includes a $16.5 billion purchase from a FDIC receivership bank
in the third quarter of 2010 and a net sale of $4.8 billion to FNMA in the second quarter of 2010. Servicing run-off of existing business slowed
to 18.2% in 2010 compared with 19.6% in 2009.
The Holding Company completed four debt financings in August 2010 in anticipation of the Acquisition, issuing $1.0 billion of 2.375% senior notes,
$1.0 billion of 4.75% senior notes, $750 million of 5.875% senior notes, and $250 million of floating rate senior notes. The Holding Company also issueddebt
securities, which are part of the $3.0 billion stated value of common equity units. The proceeds from these debt issuances were used to finance the Acquisition.
The Holding Company completed three debt issuances in 2009 in response to the economic crisis, issuing $397 million of floating rate senior notes in March
2009, $1.3 billion of senior notes in May 2009, and $500 million of junior subordinated debt securities in July 2009. The proceeds from these debt issuances
were used for general corporate purposes.
Operating earnings available to common shareholders and operating earnings, which excludes preferred stock dividends, each increased
$270 million, primarily due to an increase in net investment income and a reduction in operating expenses, partially offset by a decline in
mortgage banking revenues, a decrease in tax benefit and an increase in interest expense resulting from the debt issuances noted above.
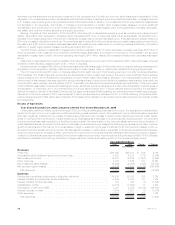
Net investment income increased $335 million reflecting an increase of $189 million due to higher yields and an increase of $146 million
from growth in average invested assets. Yields were positively impacted by the effects of recovering private equity markets and stabilizing real
estate markets on other limited partnership interests and real estate joint ventures. This was partially offset by lower fixed maturities yields
which were adversely impacted by the reinvestment of proceeds from maturities and sales during this lower interest rate environment and from
decreased trading and other securities results due to a stronger recovery in equity markets in 2009 as compared to 2010. In addition, due to
the lower interest rate environment in the current year, less net investment income was credited to the segments in 2010 compared to 2009.
Growth in average invested assets was primarily due to an increase in bank deposits, higher cash collateral balances received from our
27MetLife, Inc.