MetLife 2010 Annual Report Download - page 50
Download and view the complete annual report
Please find page 50 of the 2010 MetLife annual report below. You can navigate through the pages in the report by either clicking on the pages listed below, or by using the keyword search tool below to find specific information within the annual report.-
 1
1 -
2
-
3
-
4
-
5
-
6
-
7
-
8
-
9
-
10
-
11
-
12
-
13
-
14
-
15
-
16
-
17
-
18
-
19
-
20
-
21
-
22
-
23
-
24
-
25
-
26
-
27
-
28
-
29
-
30
-
31
-
32
-
33
-
34
-
35
-
36
-
37
-
38
-
39
-
 40
40 -
 41
41 -
 42
42 -
 43
43 -
 44
44 -
 45
45 -
 46
46 -
 47
47 -
 48
48 -
 49
49 -
 50
50 -
 51
51 -
 52
52 -
 53
53 -
 54
54 -
 55
55 -
 56
56 -
 57
57 -
 58
58 -
 59
59 -
 60
60 -
61
-
62
-
63
-
64
-
65
-
66
-
67
-
68
-
69
-
70
-
71
-
72
-
73
-
74
-
75
-
76
-
77
-
78
-
79
-
80
-
81
-
82
-
83
-
84
-
85
-
86
-
87
-
88
-
89
-
90
-
91
-
92
-
93
-
94
-
95
-
96
-
97
-
98
-
99
-
100
-
101
-
102
-
103
-
104
-
105
-
106
-
107
-
108
-
109
-
110
-
111
-
112
-
113
-
114
-
115
-
116
-
117
-
118
-
119
-
120
-
121
-
122
-
123
-
124
-
125
-
126
-
127
-
128
-
129
-
130
-
131
-
132
-
133
-
134
-
135
-
136
-
137
-
138
-
139
-
140
-
141
-
142
-
143
-
144
-
145
-
146
-
147
-
148
-
149
-
150
-
151
-
152
-
153
-
154
-
155
-
156
-
157
-
158
-
159
-
160
-
161
-
162
-
163
-
164
-
165
-
166
-
167
-
168
-
169
-
170
-
171
-
172
-
173
-
174
-
175
-
176
-
177
-
178
-
179
-
180
-
181
-
182
-
183
-
184
-
185
-
186
-
187
-
188
-
189
-
190
-
191
-
192
-
193
-
194
-
195
-
196
-
197
-
198
-
199
-
200
-
201
-
202
-
203
-
204
-
205
-
206
-
207
-
208
-
209
-
210
-
211
-
212
-
213
-
214
-
215
-
216
-
217
-
218
-
219
-
220
-
221
-
222
-
223
-
224
-
225
-
226
-
227
-
228
-
229
-
230
-
231
-
232
-
233
-
234
-
235
-
236
-
237
-
238
-
239
-
240
-
241
-
242
 |
 |

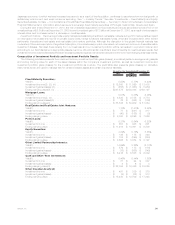
(1) Presented using the final rating from revised NAIC rating methodologies.
Fixed Maturity and Equity Securities Available-for-Sale. See “Investments — Fixed Maturity and Equity Securities Available-for-Sale” in
Note 3 of the Notes to the Consolidated Financial Statements for tables summarizing the cost or amortized cost, gross unrealized gains and
losses, including noncredit loss component of OTTI loss, and estimated fair value of fixed maturity and equity securities on a sector basis, and
selected information about certain fixed maturity securities held by the Company that were below investment grade or non-rated, non-income
producing, credit enhanced by financial guarantor insurers — by sector, and the ratings of the financial guarantor insurers providing the credit
enhancement at December 31, 2010 and 2009.
Concentrations of Credit Risk (Equity Securities). The Company was not exposed to any significant concentrations of credit risk in its
equity securities portfolio of any single issuer greater than 10% of the Company’s equity, or 1% of total investments, at December 31, 2010
and 2009.
Concentrations of Credit Risk (Fixed Maturity Securities) — Summary. See “Investments— Fixed Maturity Securities Available-for-Sale
Concentrations” in Note 3 of the Notes to the Consolidated Financial Statements for a summary of the concentrations of credit risk related to
fixed maturity securities holdings.
Corporate Fixed Maturity Securities. The Company maintains a diversified portfolio of corporate fixed maturity securities across
industries and issuers. This portfolio does not have exposure to any single issuer in excess of 1% of the total investments. See “Invest-
ments — Fixed Maturity and Equity Securities Available-for-Sale — Concentrations of Credit Risk (Fixed Maturity Securities) — U.S. and
Foreign Corporate Securities”in Note 3 of the Notes to the Consolidated Financial Statements for the tables that present the major industry
types that comprise the corporate fixed maturity securities holdings, the largest exposure to a single issuer and the combined holdings in the
ten issuers to which it had the largest exposure at December 31, 2010 and 2009.
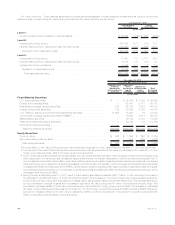
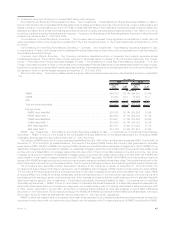
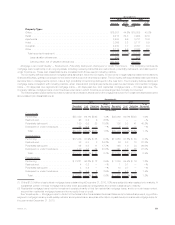
Structured Securities. The following table presents the types of structured securities and portion rated Aaa/AAA and portion rated NAIC
1at:
Estimated
Fair
Value %of
Total
Estimated
Fair
Value %of
Total
2010 2009
December 31,
(In millions)
RMBS ................................................ $44,733 56.1% $44,020 60.5%
CMBS................................................ 20,675 26.0 15,622 21.4
ABS ................................................. 14,290 17.9 13,162 18.1
Total structured securities . . . . . . . . . . . . . . . . . . . . . . . . . . . . . . . . . . . $79,698 100.0% $72,804 100.0%
Ratings profile:
RMBSratedAaa/AAA..................................... $36,085 80.7% $35,626 80.9%
RMBSratedNAIC1...................................... $38,984 87.1% $38,464 87.4%
CMBSratedAaa/AAA..................................... $16,901 81.7% $13,355 85.5%
CMBSratedNAIC1...................................... $19,385 93.7% $15,000 96.0%
ABSratedAaa/AAA...................................... $10,411 72.9% $ 9,354 71.1%
ABSratedNAIC1....................................... $13,136 91.9% $11,573 87.9%
RMBS. See “Investments — Fixed Maturity and Equity Securities Available-for-Sale — Concentrations of Credit Risk (Fixed Maturity
Securities) — RMBS” in Note 3 of the Notes to the Consolidated Financial Statements for the tables that present the Company’s RMBS
holdings by security type and risk profile at December 31, 2010 and 2009.
The majority of RMBS held by the Company was rated Aaa/AAA by Moody’s, S&P or Fitch; and the majority was rated NAIC 1 by the NAIC at
December 31, 2010 and 2009, as presented above. The majority of the agency RMBS held by the Company was guaranteed or otherwise
supported by FNMA, FHLMC or GNMA. Non-agency RMBS includes prime and alternative residential mortgage loans (“Alt-A”) RMBS. Prime
residential mortgage lending includes the origination of residential mortgage loans to the most creditworthy borrowers with high quality credit
profiles. Alt-A is a classification of mortgage loans where the risk profile of the borrower falls between prime and sub-prime. Sub-prime
mortgage lending is the origination of residential mortgage loans to borrowers with weak credit profiles. Included within Alt-A RMBS are
resecuritization of real estate mortgage investment conduit (“Re-REMIC”) securities. Re-REMIC Alt-A RMBS involve the pooling of previous
issues of Alt-A RMBS and restructuring the combined pools to create new senior and subordinated securities. The credit enhancement on the
senior tranches is improved through the resecuritization. The Company’s holdings are in senior tranches with significant credit enhancement.
The Company’s Alt-A securities portfolio has superior structure to the overall Alt-A market. At December 31, 2010 and 2009, the
Company’s Alt-A securities portfolio has no exposure to option adjustable rate mortgages (“ARMs”) and a minimal exposure to hybrid ARMs.
The Company’s Alt-A securities portfolio is comprised primarily of fixed rate mortgages which have performed better than both option ARMs
and hybrid ARMs in the overall Alt-A market. Additionally, 85% and 90% at December 31, 2010 and 2009, respectively, of the Company’s Alt-A
securities portfolio has super senior credit enhancement, which typically provides double the credit enhancement of a standard Aaa/AAA
rated fixed maturity security. See “Investments — Fixed Maturity and Equity Securities Available-for-Sale — Concentrations of Credit Risk
(Fixed Maturity Securities) — RMBS” in Note 3 of the Notes to Consolidated Financial Statements for a table that presents the estimated fair
value of Alt-A securities held by the Company by vintage year, net unrealized loss, portion of holdings rated Aa/AA or better by Moody’s, S&P
or Fitch, portion rated NAIC 1 by the NAIC, and portion of holdings that are backed by fixed rate collateral or hybrid ARM collateral at
December 31, 2010 and 2009. The Company’s holdings of Re-REMIC Alt-A RMBS reported within Alt-A RMBS were all rated NAIC 1 and were
$703 million and $782 million at estimated fair value at December 31, 2010 and 2009, respectively.
RMBS in which the present value of projected future cash flows expected to be collected is less than amortized cost are reviewed for
impairment in accordance with our impairment policy. Based upon the analysis of the Company’s exposure to RMBS, including Alt-A RMBS,
47MetLife, Inc.