MetLife 2010 Annual Report Download - page 171
Download and view the complete annual report
Please find page 171 of the 2010 MetLife annual report below. You can navigate through the pages in the report by either clicking on the pages listed below, or by using the keyword search tool below to find specific information within the annual report.-
 1
1 -
2
-
3
-
4
-
5
-
6
-
7
-
8
-
9
-
10
-
11
-
12
-
13
-
14
-
15
-
16
-
17
-
18
-
19
-
20
-
21
-
22
-
23
-
24
-
25
-
26
-
27
-
28
-
29
-
30
-
31
-
32
-
33
-
34
-
35
-
36
-
37
-
38
-
39
-
40
-
41
-
42
-
43
-
44
-
45
-
46
-
47
-
48
-
49
-
50
-
51
-
52
-
53
-
54
-
55
-
56
-
57
-
58
-
59
-
60
-
61
-
62
-
63
-
64
-
65
-
66
-
67
-
68
-
69
-
70
-
71
-
72
-
73
-
74
-
75
-
76
-
77
-
78
-
79
-
80
-
81
-
82
-
83
-
84
-
85
-
86
-
87
-
88
-
89
-
90
-
91
-
92
-
93
-
94
-
95
-
96
-
97
-
98
-
99
-
100
-
101
-
102
-
103
-
104
-
105
-
106
-
107
-
108
-
109
-
110
-
111
-
112
-
113
-
114
-
115
-
116
-
117
-
118
-
119
-
120
-
121
-
122
-
123
-
124
-
125
-
126
-
127
-
128
-
129
-
130
-
131
-
132
-
133
-
134
-
135
-
136
-
137
-
138
-
139
-
140
-
141
-
142
-
143
-
144
-
145
-
146
-
147
-
148
-
149
-
150
-
151
-
152
-
153
-
154
-
155
-
156
-
157
-
158
-
159
-
160
-
 161
161 -
 162
162 -
 163
163 -
 164
164 -
 165
165 -
 166
166 -
 167
167 -
 168
168 -
 169
169 -
 170
170 -
 171
171 -
 172
172 -
 173
173 -
 174
174 -
 175
175 -
 176
176 -
 177
177 -
 178
178 -
 179
179 -
 180
180 -
 181
181 -
182
-
183
-
184
-
185
-
186
-
187
-
188
-
189
-
190
-
191
-
192
-
193
-
194
-
195
-
196
-
197
-
198
-
199
-
200
-
201
-
202
-
203
-
204
-
205
-
206
-
207
-
208
-
209
-
210
-
211
-
212
-
213
-
214
-
215
-
216
-
217
-
218
-
219
-
220
-
221
-
222
-
223
-
224
-
225
-
226
-
227
-
228
-
229
-
230
-
231
-
232
-
233
-
234
-
235
-
236
-
237
-
238
-
239
-
240
-
241
-
242
 |
 |
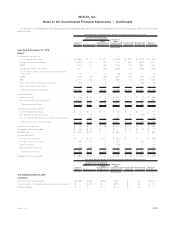
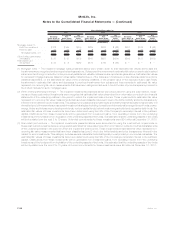
($113) million, respectively, for the year ended December 31, 2009. The additions and reductions (due to loan payments) affecting
MSRs were $350 million and ($10) million, respectively, for the year ended December 31, 2008.
(6) The changes in estimated fair value due to changes in valuation model inputs or assumptions and other changes in estimated fair value
affecting MSRs were ($79) million, $172 million and ($149) million for the years ended December 31, 2010, 2009 and 2008,
respectively.
(7) Freestanding derivative assets and liabilities are presented net for purposes of the rollforward.
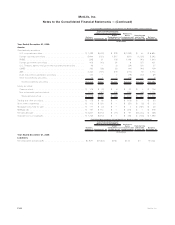
(8) Investment performance related to separate account assets is fully offset by corresponding amounts credited to contractholders whose
liability is reflected within separate account liabilities.
(9) Embedded derivative assets and liabilities are presented net for purposes of the rollforward.
(10) The long-term debt at January 1, 2010 of the CSEs is reported within the purchases, sales, issuances and settlements activity column of
the rollforward.
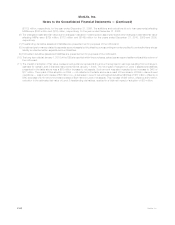
(11) The impact of adoption of fair value measurement guidance represents the amount recognized in earnings resulting from a change in
estimate for certain Level 3 financial instruments held at January 1, 2008. The net impact of adoption on Level 3 assets and liabilities
presented in the table above was a $23 million increase to net assets. Such amount was also impacted by an increase to DAC of
$17 million. The impact of this adoption on RGA — not reflected in the table above as a result of the inclusion of RGA in discontinued
operations — was a net increase of $2 million (i.e., a decrease in Level 3 net embedded derivative liabilities of $17 million, offset by a
DAC decrease of $15 million) for a total increase of $42 million in Level 3 net assets. This increase of $42 million, offset by a $12 million
reduction in the estimated fair value of Level 2 freestanding derivatives, resulted in a total net impact of adoption of $30 million.
F-82 MetLife, Inc.
MetLife, Inc.
Notes to the Consolidated Financial Statements — (Continued)