MetLife 2010 Annual Report Download - page 55
Download and view the complete annual report
Please find page 55 of the 2010 MetLife annual report below. You can navigate through the pages in the report by either clicking on the pages listed below, or by using the keyword search tool below to find specific information within the annual report.-
 1
1 -
2
-
3
-
4
-
5
-
6
-
7
-
8
-
9
-
10
-
11
-
12
-
13
-
14
-
15
-
16
-
17
-
18
-
19
-
20
-
21
-
22
-
23
-
24
-
25
-
26
-
27
-
28
-
29
-
30
-
31
-
32
-
33
-
34
-
35
-
36
-
37
-
38
-
39
-
40
-
41
-
42
-
43
-
44
-
 45
45 -
 46
46 -
 47
47 -
 48
48 -
 49
49 -
 50
50 -
 51
51 -
 52
52 -
 53
53 -
 54
54 -
 55
55 -
 56
56 -
 57
57 -
 58
58 -
 59
59 -
 60
60 -
 61
61 -
 62
62 -
 63
63 -
 64
64 -
 65
65 -
66
-
67
-
68
-
69
-
70
-
71
-
72
-
73
-
74
-
75
-
76
-
77
-
78
-
79
-
80
-
81
-
82
-
83
-
84
-
85
-
86
-
87
-
88
-
89
-
90
-
91
-
92
-
93
-
94
-
95
-
96
-
97
-
98
-
99
-
100
-
101
-
102
-
103
-
104
-
105
-
106
-
107
-
108
-
109
-
110
-
111
-
112
-
113
-
114
-
115
-
116
-
117
-
118
-
119
-
120
-
121
-
122
-
123
-
124
-
125
-
126
-
127
-
128
-
129
-
130
-
131
-
132
-
133
-
134
-
135
-
136
-
137
-
138
-
139
-
140
-
141
-
142
-
143
-
144
-
145
-
146
-
147
-
148
-
149
-
150
-
151
-
152
-
153
-
154
-
155
-
156
-
157
-
158
-
159
-
160
-
161
-
162
-
163
-
164
-
165
-
166
-
167
-
168
-
169
-
170
-
171
-
172
-
173
-
174
-
175
-
176
-
177
-
178
-
179
-
180
-
181
-
182
-
183
-
184
-
185
-
186
-
187
-
188
-
189
-
190
-
191
-
192
-
193
-
194
-
195
-
196
-
197
-
198
-
199
-
200
-
201
-
202
-
203
-
204
-
205
-
206
-
207
-
208
-
209
-
210
-
211
-
212
-
213
-
214
-
215
-
216
-
217
-
218
-
219
-
220
-
221
-
222
-
223
-
224
-
225
-
226
-
227
-
228
-
229
-
230
-
231
-
232
-
233
-
234
-
235
-
236
-
237
-
238
-
239
-
240
-
241
-
242
 |
 |

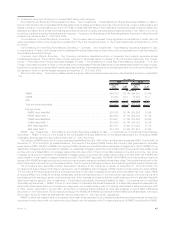
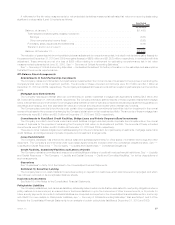
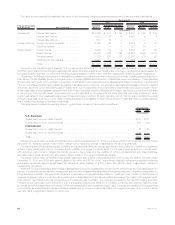
A rollforward of the fair value measurements for trading and other securities measured at estimated fair value on a recurring basis using
significant unobservable (Level 3) inputs for the year ended December 31, 2010, is as follows:
Year Ended
December 31, 2010
(In millions)
Balance,atJanuary1, .................................................... $ 83
Total realized/unrealized gains (losses) included in:
Earnings .......................................................... (7)
Purchases,sales,issuancesandsettlements(1) .................................. 727
Transferinand/oroutofLevel3 ............................................ 19
Balance,atDecember31, ................................................ $822
(1) Includes securities acquired from ALICO of $582 million.
See “— Summary of Critical Accounting Estimates” for further information on the estimates and assumptions that affect the amounts
reported above.
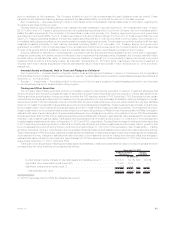
Mortgage Loans
The Company’s mortgage loans are principally collateralized by commercial real estate, agricultural real estate and residential properties.
The carrying value of mortgage loans was $62.4 billion and $50.9 billion, or 13.1% and 15.1% of total cash and invested assets at
December 31, 2010 and 2009, respectively. See “Investments — Mortgage Loans” in Note 3 of the Notes to the Consolidated Financial
Statements for a table that presents the Company’s mortgage loans held-for-investment of $59.1 billion and $48.2 billion by portfolio segment
at December 31, 2010 and 2009, respectively, as well as the components of the mortgage loans held-for-sale of $3.3 billion and $2.7 billion at
December 31, 2010 and 2009, respectively. The information presented on Mortgage Loans herein excludes the effects of consolidating
under GAAP certain VIEs that are treated as CSEs. Such amounts are presented in the aforementioned table. See “Investments — Mortgage
Loans” in Note 3 of the Notes to the Consolidated Financial Statements.
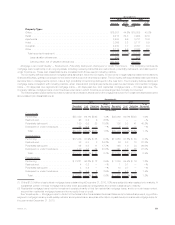
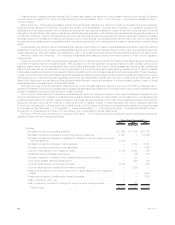
Commercial Mortgage Loans by Geographic Region and Property Type. Commercial mortgage loans are the most significant component
of the mortgage loan invested asset class as it represents 72% of total mortgage loans held-for-investment (excluding the effects of
consolidating under GAAP certain VIEs that are treated as CSEs) at both December 31, 2010 and 2009. The Company diversifies its
commercial mortgage loan portfolio by both geographic region and property type to reduce the risk of concentration. Additionally, the
Company manages risk, when originating commercial and agricultural mortgage loans, by generally lending only up to 75% of the estimated
fair value of the underlying real estate. The tables below present the diversification across geographic regions and property types for
commercial mortgage loans at:
Amount %of
Total Amount %of
Total
2010 2009
December 31,
(In millions)
Region:
Pacific ................................................ $ 8,974 23.7% $ 8,822 25.1%
SouthAtlantic............................................ 8,016 21.2 7,460 21.2
MiddleAtlantic ........................................... 6,484 17.1 6,042 17.2
International............................................. 4,216 11.2 3,620 10.3
WestSouthCentral........................................ 3,266 8.6 2,916 8.3
EastNorthCentral......................................... 3,066 8.1 2,531 7.2
NewEngland ............................................ 1,531 4.1 1,448 4.1
Mountain............................................... 884 2.3 959 2.7
WestNorthCentral ........................................ 666 1.8 675 1.9
EastSouthCentral ........................................ 461 1.2 449 1.3
Other................................................. 256 0.7 254 0.7
Total recorded investment . . . . . . . . . . . . . . . . . . . . . . . . . . . . . . . . . . 37,820 100.0% 35,176 100.0%
Lessvaluationallowances................................. 562 589
Carryingvalue,netofvaluationallowances...................... $37,258 $34,587
52 MetLife, Inc.