MetLife 2010 Annual Report Download - page 77
Download and view the complete annual report
Please find page 77 of the 2010 MetLife annual report below. You can navigate through the pages in the report by either clicking on the pages listed below, or by using the keyword search tool below to find specific information within the annual report.-
 1
1 -
2
-
3
-
4
-
5
-
6
-
7
-
8
-
9
-
10
-
11
-
12
-
13
-
14
-
15
-
16
-
17
-
18
-
19
-
20
-
21
-
22
-
23
-
24
-
25
-
26
-
27
-
28
-
29
-
30
-
31
-
32
-
33
-
34
-
35
-
36
-
37
-
38
-
39
-
40
-
41
-
42
-
43
-
44
-
45
-
46
-
47
-
48
-
49
-
50
-
51
-
52
-
53
-
54
-
55
-
56
-
57
-
58
-
59
-
60
-
61
-
62
-
63
-
64
-
65
-
66
-
 67
67 -
 68
68 -
 69
69 -
 70
70 -
 71
71 -
 72
72 -
 73
73 -
 74
74 -
 75
75 -
 76
76 -
 77
77 -
 78
78 -
 79
79 -
 80
80 -
 81
81 -
 82
82 -
 83
83 -
 84
84 -
 85
85 -
 86
86 -
 87
87 -
88
-
89
-
90
-
91
-
92
-
93
-
94
-
95
-
96
-
97
-
98
-
99
-
100
-
101
-
102
-
103
-
104
-
105
-
106
-
107
-
108
-
109
-
110
-
111
-
112
-
113
-
114
-
115
-
116
-
117
-
118
-
119
-
120
-
121
-
122
-
123
-
124
-
125
-
126
-
127
-
128
-
129
-
130
-
131
-
132
-
133
-
134
-
135
-
136
-
137
-
138
-
139
-
140
-
141
-
142
-
143
-
144
-
145
-
146
-
147
-
148
-
149
-
150
-
151
-
152
-
153
-
154
-
155
-
156
-
157
-
158
-
159
-
160
-
161
-
162
-
163
-
164
-
165
-
166
-
167
-
168
-
169
-
170
-
171
-
172
-
173
-
174
-
175
-
176
-
177
-
178
-
179
-
180
-
181
-
182
-
183
-
184
-
185
-
186
-
187
-
188
-
189
-
190
-
191
-
192
-
193
-
194
-
195
-
196
-
197
-
198
-
199
-
200
-
201
-
202
-
203
-
204
-
205
-
206
-
207
-
208
-
209
-
210
-
211
-
212
-
213
-
214
-
215
-
216
-
217
-
218
-
219
-
220
-
221
-
222
-
223
-
224
-
225
-
226
-
227
-
228
-
229
-
230
-
231
-
232
-
233
-
234
-
235
-
236
-
237
-
238
-
239
-
240
-
241
-
242
 |
 |

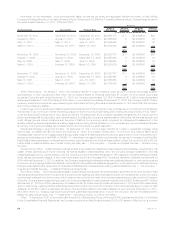
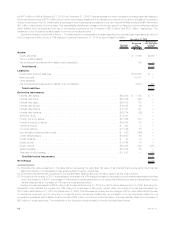
Senior Notes. The following table summarizes the Holding Company’s outstanding senior notes series by maturity date, excluding any
premium or discount, at December 31, 2010:
Maturity Date Principal Interest Rate
(In millions)
2011 . . . . . . . . . . . . . . . . . . . . . . . . . . . . . . . . . . . . . . . . . . . . . . . . . $ 750 6.13%
2012 . . . . . . . . . . . . . . . . . . . . . . . . . . . . . . . . . . . . . . . . . . . . . . . . . $ 400 5.38%
2012 . . . . . . . . . . . . . . . . . . . . . . . . . . . . . . . . . . . . . . . . . . . . . . . . . $ 397 3-month LIBOR + .032%
2013 . . . . . . . . . . . . . . . . . . . . . . . . . . . . . . . . . . . . . . . . . . . . . . . . . $ 500 5.00%
2013 . . . . . . . . . . . . . . . . . . . . . . . . . . . . . . . . . . . . . . . . . . . . . . . . . $ 250 3-month LIBOR + 1.25%
2014 . . . . . . . . . . . . . . . . . . . . . . . . . . . . . . . . . . . . . . . . . . . . . . . . . $ 350 5.50%
2014 . . . . . . . . . . . . . . . . . . . . . . . . . . . . . . . . . . . . . . . . . . . . . . . . . $1,000 2.38%
2015 . . . . . . . . . . . . . . . . . . . . . . . . . . . . . . . . . . . . . . . . . . . . . . . . . $1,000 5.00%
2016 . . . . . . . . . . . . . . . . . . . . . . . . . . . . . . . . . . . . . . . . . . . . . . . . . $1,250 6.75%
2018 . . . . . . . . . . . . . . . . . . . . . . . . . . . . . . . . . . . . . . . . . . . . . . . . . $1,035 6.82%
2018(1) . . . . . . . . . . . . . . . . . . . . . . . . . . . . . . . . . . . . . . . . . . . . . . . . $ 500 1.56%
2018(2) . . . . . . . . . . . . . . . . . . . . . . . . . . . . . . . . . . . . . . . . . . . . . . . . $ 500 2.46%
2019 . . . . . . . . . . . . . . . . . . . . . . . . . . . . . . . . . . . . . . . . . . . . . . . . . $1,035 7.72%
2020 . . . . . . . . . . . . . . . . . . . . . . . . . . . . . . . . . . . . . . . . . . . . . . . . . $ 729 5.25%
2021 . . . . . . . . . . . . . . . . . . . . . . . . . . . . . . . . . . . . . . . . . . . . . . . . . $1,000 4.75%
2023(1) . . . . . . . . . . . . . . . . . . . . . . . . . . . . . . . . . . . . . . . . . . . . . . . . $ 500 1.56%
2024 . . . . . . . . . . . . . . . . . . . . . . . . . . . . . . . . . . . . . . . . . . . . . . . . . $1,000 1.92%
2024 . . . . . . . . . . . . . . . . . . . . . . . . . . . . . . . . . . . . . . . . . . . . . . . . . $ 673 5.38%
2032 . . . . . . . . . . . . . . . . . . . . . . . . . . . . . . . . . . . . . . . . . . . . . . . . . $ 600 6.50%
2033 . . . . . . . . . . . . . . . . . . . . . . . . . . . . . . . . . . . . . . . . . . . . . . . . . $ 200 5.88%
2034 . . . . . . . . . . . . . . . . . . . . . . . . . . . . . . . . . . . . . . . . . . . . . . . . . $ 750 6.38%
2035 . . . . . . . . . . . . . . . . . . . . . . . . . . . . . . . . . . . . . . . . . . . . . . . . . $1,000 5.70%
2041 . . . . . . . . . . . . . . . . . . . . . . . . . . . . . . . . . . . . . . . . . . . . . . . . . $ 750 5.88%
2045(2) . . . . . . . . . . . . . . . . . . . . . . . . . . . . . . . . . . . . . . . . . . . . . . . . $ 500 2.46%
(1) Represents one of two tranches comprising the Series C Debt Securities.
(2) Represents one of two tranches comprising the Series E Debt Securities.
Collateral Financing Arrangements. For information on collateral financing arrangements entered into by the Holding Company, see
“— The Company — Liquidity and Capital Sources — Collateral Financing Arrangements.”
Credit and Committed Facilities. At December 31, 2010, the Holding Company, along with MetLife Funding, maintained $4.0 billion in
unsecured credit facilities, the proceeds of which are available to be used for general corporate purposes, to support the borrowers’
commercial paper programs and for the issuance of letters of credit. At December 31, 2010, the Holding Company had outstanding
$1.5 billion in letters of credit and no drawdowns against this facility. Remaining unused commitments were $2.5 billion at December 31,
2010.
The Holding Company maintains committed facilities with a capacity of $300 million. At December 31, 2010, the Holding Company had
outstanding $300 million in letters of credit and no drawdowns against these facilities. There were no remaining unused commitments at
December 31, 2010. In addition, the Holding Company is a party to committed facilities of certain of its subsidiaries, which aggregated
$12.1 billion at December 31, 2010. The committed facilities are used as collateral for certain of the Company’s affiliated reinsurance
liabilities.
See Note 11 of the Notes to the Consolidated Financial Statements for further detail on these facilities.
Covenants. Certain of the Holding Company’s debt instruments, credit facilities and committed facilities contain various administrative,
reporting, legal and financial covenants. The Holding Company believes it was in compliance with all covenants at December 31, 2010 and
2009.
Preferred Stock, Convertible Preferred Stock, Common Stock and Equity Units. For information on preferred stock, convertible
preferred stock, common stock and common equity units issued by the Holding Company, see “— The Company — Liquidity and Capital
Sources — Preferred Stock,” “— Convertible Preferred Stock,” “— Common Stock,” and “— Equity Units,” respectively.
Liquidity and Capital Uses
The primary uses of liquidity of the Holding Company include debt service, cash dividends on preferred, convertible preferred and
common stock, capital contributions to subsidiaries, payment of general operating expenses and acquisitions. Based on our analysis and
comparison of our current and future cash inflows from the dividends we receive from subsidiaries that are permitted to be paid without prior
insurance regulatory approval, our asset portfolio and other cash flows and anticipated access to the capital markets, we believe there will be
sufficient liquidity and capital to enable the Holding Company to make payments on debt, make cash dividend payments on its preferred,
convertible preferred and common stock, contribute capital to its subsidiaries, pay all general operating expenses and meet its cash needs.
Acquisitions. For information regarding the purchase price of the Acquisition, see “— The Company — Liquidity and Capital Uses —
Acquisitions.”
Affiliated Capital Transactions. During the years ended December 31, 2010, 2009 and 2008, the Holding Company invested an
aggregate of $699 million (excludes the Acquisition), $986 million and $2.6 billion, respectively, in various subsidiaries.
74 MetLife, Inc.