MetLife 2010 Annual Report Download - page 56
Download and view the complete annual report
Please find page 56 of the 2010 MetLife annual report below. You can navigate through the pages in the report by either clicking on the pages listed below, or by using the keyword search tool below to find specific information within the annual report.-
 1
1 -
2
-
3
-
4
-
5
-
6
-
7
-
8
-
9
-
10
-
11
-
12
-
13
-
14
-
15
-
16
-
17
-
18
-
19
-
20
-
21
-
22
-
23
-
24
-
25
-
26
-
27
-
28
-
29
-
30
-
31
-
32
-
33
-
34
-
35
-
36
-
37
-
38
-
39
-
40
-
41
-
42
-
43
-
44
-
45
-
 46
46 -
 47
47 -
 48
48 -
 49
49 -
 50
50 -
 51
51 -
 52
52 -
 53
53 -
 54
54 -
 55
55 -
 56
56 -
 57
57 -
 58
58 -
 59
59 -
 60
60 -
 61
61 -
 62
62 -
 63
63 -
 64
64 -
 65
65 -
 66
66 -
67
-
68
-
69
-
70
-
71
-
72
-
73
-
74
-
75
-
76
-
77
-
78
-
79
-
80
-
81
-
82
-
83
-
84
-
85
-
86
-
87
-
88
-
89
-
90
-
91
-
92
-
93
-
94
-
95
-
96
-
97
-
98
-
99
-
100
-
101
-
102
-
103
-
104
-
105
-
106
-
107
-
108
-
109
-
110
-
111
-
112
-
113
-
114
-
115
-
116
-
117
-
118
-
119
-
120
-
121
-
122
-
123
-
124
-
125
-
126
-
127
-
128
-
129
-
130
-
131
-
132
-
133
-
134
-
135
-
136
-
137
-
138
-
139
-
140
-
141
-
142
-
143
-
144
-
145
-
146
-
147
-
148
-
149
-
150
-
151
-
152
-
153
-
154
-
155
-
156
-
157
-
158
-
159
-
160
-
161
-
162
-
163
-
164
-
165
-
166
-
167
-
168
-
169
-
170
-
171
-
172
-
173
-
174
-
175
-
176
-
177
-
178
-
179
-
180
-
181
-
182
-
183
-
184
-
185
-
186
-
187
-
188
-
189
-
190
-
191
-
192
-
193
-
194
-
195
-
196
-
197
-
198
-
199
-
200
-
201
-
202
-
203
-
204
-
205
-
206
-
207
-
208
-
209
-
210
-
211
-
212
-
213
-
214
-
215
-
216
-
217
-
218
-
219
-
220
-
221
-
222
-
223
-
224
-
225
-
226
-
227
-
228
-
229
-
230
-
231
-
232
-
233
-
234
-
235
-
236
-
237
-
238
-
239
-
240
-
241
-
242
 |
 |

Amount %of
Total Amount %of
Total
2010 2009
December 31,
(In millions)
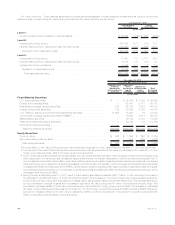
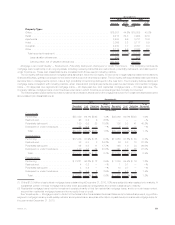
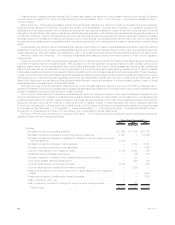
Property Type:
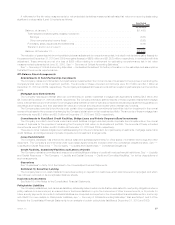
Office................................................. $16,857 44.6% $15,205 43.2%
Retail ................................................. 9,215 24.3 7,964 22.6
Apartments ............................................. 3,630 9.6 3,731 10.6
Hotel ................................................. 3,089 8.2 3,117 8.9
Industrial............................................... 2,910 7.7 2,797 8.0
Other................................................. 2,119 5.6 2,362 6.7
Total recorded investment . . . . . . . . . . . . . . . . . . . . . . . . . . . . . . . . . . 37,820 100.0% 35,176 100.0%
Lessvaluationallowances................................. 562 589
Carryingvalue,netofvaluationallowances...................... $37,258 $34,587
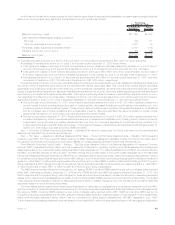
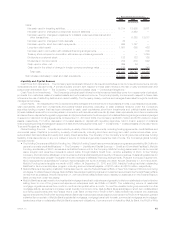
Mortgage Loan Credit Quality — Restructured, Potentially Delinquent, Delinquent or Under Foreclosure. The Company monitors its
mortgage loan investments on an ongoing basis, including reviewing loans that are restructured, potentially delinquent, and delinquent or
under foreclosure. These loan classifications are consistent with those used in industry practice.
The Company defines restructured mortgage loans as loans in which the Company, for economic or legal reasons related to the debtor’s
financial difficulties, grants a concession to the debtor that it would not otherwise consider. The Company defines potentially delinquent loans
as loans that, in management’s opinion, have a high probability of becoming delinquent in the near term. The Company defines delinquent
mortgage loans consistent with industry practice, when interest and principal payments are past due as follows: commercial mortgage
loans — 60 days past due; agricultural mortgage loans — 90 days past due; and residential mortgage loans — 60 days past due. The
Company defines mortgage loans under foreclosure as loans in which foreclosure proceedings have formally commenced.
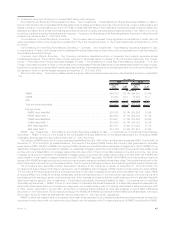
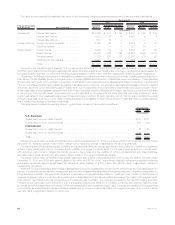
The following table presents the recorded investment and valuation allowance for all mortgage loans held-for-investment distributed by the
above stated loan classifications at:
Recorded
Investment %of
Total Valuation
Allowance
%of
Recorded
Investment Recorded
Investment %of
Total Valuation
Allowance
%of
Recorded
Investment
2010 2009
December 31,
(In millions)
Commercial:
Performing . . . . . . . . . . . . . . . . . . . . . $37,489 99.1% $528 1.4% $35,066 99.7% $548 1.6%
Restructured.................... 93 0.2 6 6.5% — — — —%
Potentially delinquent . . . . . . . . . . . . . . 180 0.5 28 15.6% 102 0.3 41 40.2%
Delinquent or under foreclosure . . . . . . . . 58 0.2 — —% 8 — — —%
Total . . . . . . . . . . . . . . . . . . . . . . . . $37,820 100.0% $562 1.5% $35,176 100.0% $589 1.7%
Agricultural(1):
Performing ..................... $12,486 97.9% $ 35 0.3% $11,950 97.5% $ 33 0.3%
Restructured.................... 33 0.3 8 24.2% 36 0.3 10 27.8%
Potentially delinquent . . . . . . . . . . . . . . 62 0.5 11 17.7% 128 1.0 34 26.6%
Delinquent or under foreclosure . . . . . . . . 170 1.3 34 20.0% 141 1.2 38 27.0%
Total . . . . . . . . . . . . . . . . . . . . . . . . $12,751 100.0% $ 88 0.7% $12,255 100.0% $115 0.9%
Residential(2):
Performing ..................... $ 2,221 96.2% $ 12 0.5% $ 1,389 94.4% $ 16 1.2%
Restructured.................... 4 0.2 — —% 1 0.1 — —%
Potentiallydelinquent .............. 4 0.2 — —% 10 0.7 — —%
Delinquent or under foreclosure . . . . . . . . 79 3.4 2 2.5% 71 4.8 1 1.4%
Total . . . . . . . . . . . . . . . . . . . . . . . . $ 2,308 100.0% $ 14 0.6% $ 1,471 100.0% $ 17 1.2%
(1) Of the $12.8 billion of agricultural mortgage loans outstanding at December 31, 2010, 53% were subject to rate resets prior to maturity. A
substantial portion of these mortgage loans have been successfully renegotiated and remain outstanding to maturity.
(2) Residential mortgage loans held-for-investment consist primarily of first lien residential mortgage loans, and to a much lesser extent,
second lien residential mortgage loans and home equity lines of credit.
See “Investments — Mortgage Loans” in Note 3 of the Notes to the Consolidated Financial Statements for tables that present, by portfolio
segment, mortgage loans by credit quality indicator and impaired loans, as well as information on past due and nonaccrual mortgage loans for
the year ended December 31, 2010.
53MetLife, Inc.