MetLife 2010 Annual Report Download - page 37
Download and view the complete annual report
Please find page 37 of the 2010 MetLife annual report below. You can navigate through the pages in the report by either clicking on the pages listed below, or by using the keyword search tool below to find specific information within the annual report.-
 1
1 -
2
-
3
-
4
-
5
-
6
-
7
-
8
-
9
-
10
-
11
-
12
-
13
-
14
-
15
-
16
-
17
-
18
-
19
-
20
-
21
-
22
-
23
-
24
-
25
-
26
-
 27
27 -
 28
28 -
 29
29 -
 30
30 -
 31
31 -
 32
32 -
 33
33 -
 34
34 -
 35
35 -
 36
36 -
 37
37 -
 38
38 -
 39
39 -
 40
40 -
 41
41 -
 42
42 -
 43
43 -
 44
44 -
 45
45 -
 46
46 -
 47
47 -
48
-
49
-
50
-
51
-
52
-
53
-
54
-
55
-
56
-
57
-
58
-
59
-
60
-
61
-
62
-
63
-
64
-
65
-
66
-
67
-
68
-
69
-
70
-
71
-
72
-
73
-
74
-
75
-
76
-
77
-
78
-
79
-
80
-
81
-
82
-
83
-
84
-
85
-
86
-
87
-
88
-
89
-
90
-
91
-
92
-
93
-
94
-
95
-
96
-
97
-
98
-
99
-
100
-
101
-
102
-
103
-
104
-
105
-
106
-
107
-
108
-
109
-
110
-
111
-
112
-
113
-
114
-
115
-
116
-
117
-
118
-
119
-
120
-
121
-
122
-
123
-
124
-
125
-
126
-
127
-
128
-
129
-
130
-
131
-
132
-
133
-
134
-
135
-
136
-
137
-
138
-
139
-
140
-
141
-
142
-
143
-
144
-
145
-
146
-
147
-
148
-
149
-
150
-
151
-
152
-
153
-
154
-
155
-
156
-
157
-
158
-
159
-
160
-
161
-
162
-
163
-
164
-
165
-
166
-
167
-
168
-
169
-
170
-
171
-
172
-
173
-
174
-
175
-
176
-
177
-
178
-
179
-
180
-
181
-
182
-
183
-
184
-
185
-
186
-
187
-
188
-
189
-
190
-
191
-
192
-
193
-
194
-
195
-
196
-
197
-
198
-
199
-
200
-
201
-
202
-
203
-
204
-
205
-
206
-
207
-
208
-
209
-
210
-
211
-
212
-
213
-
214
-
215
-
216
-
217
-
218
-
219
-
220
-
221
-
222
-
223
-
224
-
225
-
226
-
227
-
228
-
229
-
230
-
231
-
232
-
233
-
234
-
235
-
236
-
237
-
238
-
239
-
240
-
241
-
242
 |
 |

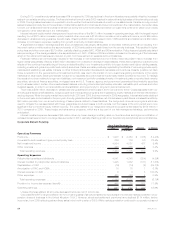
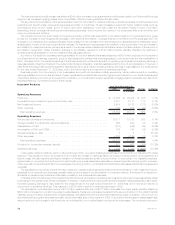
Also contributing to the increase in operating earnings was an increase in net investment income of $308 million, which was primarily due
to a $286 million increase from growth in average invested assets and a $22 million increase in yields. The increase in average invested assets
was due to increased cash flows from the sales of fixed annuity products and more customers electing the fixed option on variable annuity
sales, which were reinvested primarily in fixed maturity securities, other invested assets and mortgage loans. The increase in yields was due to
moderate improvement in the equity markets in 2009 which led to an increase in yields principally for other limited partnership interests and
certain other invested assets, which was partially offset by a decrease in yields on real estate joint ventures, reflecting the severe downturn in
the global financial markets. To manage the needs of our intermediate to longer-term liabilities, our portfolio consists primarily of investment
grade corporate fixed maturity securities, structured finance securities, mortgage loans and U.S. Treasury, agency and government
guaranteed fixed maturity securities and, to a lesser extent, certain other invested asset classes, including real estate joint ventures in
order to provide additional diversification and opportunity for long-term yield enhancement. As is typically the case with fixed annuity
products, higher net investment income was somewhat offset by higher interest credited expense. Growth in our fixed annuity policyholder
account balances increased interest credited expense by $186 million in 2009 and higher average crediting rates on fixed annuities increased
interest credited expense by $27 million.
Operating earnings were negatively impacted by $348 million of operating losses related to the hedging programs for variable annuity
minimum death and income benefit guarantees, which are not embedded derivatives, partially offset by a decrease in the liability established
for these variable annuity guarantees. The various hedging strategies in place to offset the risk associated with these variable annuity
guarantee benefits were more sensitive to market movements than the liability for the guaranteed benefit. Market volatility, improvements in
the equity markets, and higher interest rates produced operating losses on these hedging strategies in the current year. Our hedging
strategies, which are a key part of our risk management, performed as anticipated. The decrease in annuity guarantee benefit liabilities was
due to the improvement in the equity markets, higher interest rates and the annual unlocking of future market expectations.
Other expenses increased by $216 million primarily due to an increase of $123 million from the impact of market conditions on certain
expenses. These expenses are largely comprised of reinsurance costs, pension and postretirement benefit expenses, and letter of credit
fees. In addition, variable expenses, such as commissions and premium taxes, increased $77 million, the majority of which have been offset
by DAC capitalization. The positive impact of our enterprise-wide cost reduction and revenue enhancement initiative was reflected in lower
travel, professional services and advertising expenses, but was more than offset by increases largely due to business growth.
Finally, policy fees and other revenues decreased by $100 million, mainly due to lower average separate account balances in the current
year versus prior year.
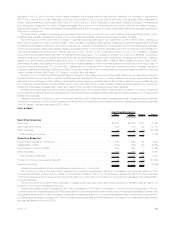
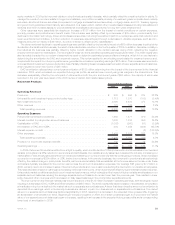
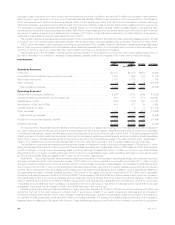
Corporate Benefit Funding
2009 2008 Change % Change
Years Ended December 31,
(In millions)
Operating Revenues
Premiums................................................... $2,264 $2,348 $ (84) (3.6)%
Universallifeandinvestment-typeproductpolicyfees ...................... 176 227 (51) (22.5)%
Netinvestmentincome .......................................... 4,527 5,615 (1,088) (19.4)%
Otherrevenues ............................................... 238 358 (120) (33.5)%
Totaloperatingrevenues........................................ 7,205 8,548 (1,343) (15.7)%
Operating Expenses
Policyholderbenefitsanddividends .................................. 4,245 4,398 (153) (3.5)%
Interestcreditedtopolicyholderaccountbalances ........................ 1,632 2,297 (665) (29.0)%
CapitalizationofDAC ........................................... (14) (18) 4 22.2%
AmortizationofDACandVOBA..................................... 15 29 (14) (48.3)%
Interestexpenseondebt......................................... 3 2 1 50.0%
Otherexpenses............................................... 456 440 16 3.6%
Totaloperatingexpenses ....................................... 6,337 7,148 (811) (11.3)%
Provisionforincometaxexpense(benefit).............................. 288 474 (186) (39.2)%
Operatingearnings............................................. $ 580 $ 926 $ (346) (37.4)%
Corporate Benefit Funding benefited in certain markets in 2009 as a flight to quality helped drive our increase in market share, especially in
the structured settlement business, where we experienced a 53% increase in premiums. Our pension closeout business in the U.K .continues
to expand and experienced premium growth during 2009 of almost $400 million, or 105% before income taxes. However, this growth was
more than offset by a decline in our domestic pension closeout business driven by unfavorable market conditions and regulatory changes. A
combination of poor equity returns and lower interest rates have contributed to pension plans being under funded, which reduces our
customers’ flexibility to engage in transactions such as pension closeouts. Our customers’ plans funded status may be affected by a variety of
factors, including the ongoing phased implementation of the Pension Protection Act of 2006, a comprehensive reform of defined benefit and
defined contribution plan rules. For each of these businesses, the movement in premiums is almost entirely offset by the related change in
policyholder benefits. The insurance liability that is established at the time we assume the risk under these contracts is typically equivalent to
the premium earned.
Market conditions also contributed to a lower demand for several of our investment-type products. The decrease in sales of these
investment-type products is not necessarily evident in our results of operations as the transactions related to these products are recorded
through the balance sheet. Our funding agreement products, primarily the LIBOR based contracts, experienced the most significant impact
from the volatile market conditions. As companies seek greater liquidity, investment managers are refraining from repurchasing the contracts
34 MetLife, Inc.