MetLife 2010 Annual Report Download - page 23
Download and view the complete annual report
Please find page 23 of the 2010 MetLife annual report below. You can navigate through the pages in the report by either clicking on the pages listed below, or by using the keyword search tool below to find specific information within the annual report.-
 1
1 -
2
-
3
-
4
-
5
-
6
-
7
-
8
-
9
-
10
-
11
-
12
-
 13
13 -
 14
14 -
 15
15 -
 16
16 -
 17
17 -
 18
18 -
 19
19 -
 20
20 -
 21
21 -
 22
22 -
 23
23 -
 24
24 -
 25
25 -
 26
26 -
 27
27 -
 28
28 -
 29
29 -
 30
30 -
 31
31 -
 32
32 -
 33
33 -
34
-
35
-
36
-
37
-
38
-
39
-
40
-
41
-
42
-
43
-
44
-
45
-
46
-
47
-
48
-
49
-
50
-
51
-
52
-
53
-
54
-
55
-
56
-
57
-
58
-
59
-
60
-
61
-
62
-
63
-
64
-
65
-
66
-
67
-
68
-
69
-
70
-
71
-
72
-
73
-
74
-
75
-
76
-
77
-
78
-
79
-
80
-
81
-
82
-
83
-
84
-
85
-
86
-
87
-
88
-
89
-
90
-
91
-
92
-
93
-
94
-
95
-
96
-
97
-
98
-
99
-
100
-
101
-
102
-
103
-
104
-
105
-
106
-
107
-
108
-
109
-
110
-
111
-
112
-
113
-
114
-
115
-
116
-
117
-
118
-
119
-
120
-
121
-
122
-
123
-
124
-
125
-
126
-
127
-
128
-
129
-
130
-
131
-
132
-
133
-
134
-
135
-
136
-
137
-
138
-
139
-
140
-
141
-
142
-
143
-
144
-
145
-
146
-
147
-
148
-
149
-
150
-
151
-
152
-
153
-
154
-
155
-
156
-
157
-
158
-
159
-
160
-
161
-
162
-
163
-
164
-
165
-
166
-
167
-
168
-
169
-
170
-
171
-
172
-
173
-
174
-
175
-
176
-
177
-
178
-
179
-
180
-
181
-
182
-
183
-
184
-
185
-
186
-
187
-
188
-
189
-
190
-
191
-
192
-
193
-
194
-
195
-
196
-
197
-
198
-
199
-
200
-
201
-
202
-
203
-
204
-
205
-
206
-
207
-
208
-
209
-
210
-
211
-
212
-
213
-
214
-
215
-
216
-
217
-
218
-
219
-
220
-
221
-
222
-
223
-
224
-
225
-
226
-
227
-
228
-
229
-
230
-
231
-
232
-
233
-
234
-
235
-
236
-
237
-
238
-
239
-
240
-
241
-
242
 |
 |

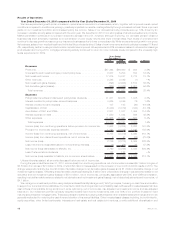
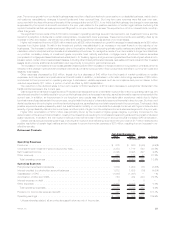
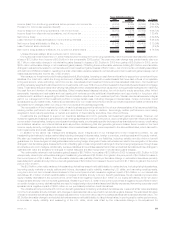
income (loss) from continuing operations, net of income tax. Operating earnings available to common shareholders increased by $1.5 billion
to $3.9 billion in 2010 from $2.4 billion in 2009.
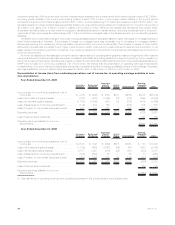
Reconciliation of income (loss) from continuing operations, net of income tax, to operating earnings available to com-
mon shareholders
Year Ended December 31, 2010
Insurance
Products Retirement
Products
Corporate
Benefit
Funding Auto &
Home International
Banking,
Corporate
& Other Total
(In millions)
Income (loss) from continuing operations, net of
income tax . . . . . . . . . . . . . . . . . . . . . . . . . . . . $1,371 $ 813 $1,002 $295 $(131) $(573) $2,777
Less: Net investment gains (losses) . . . . . . . . . . . . . 103 139 176 (7) (273) (530) (392)
Less: Net derivative gains (losses) . . . . . . . . . . . . . . 215 266 (193) (1) (491) (61) (265)
Less: Adjustments to continuing operations(1) . . . . . . (237) (282) 143 — (427) (178) (981)
Less: Provision for income tax (expense) benefit . . . . . (31) (49) (44) 3 268 254 401
Operatingearnings........................ $1,321 $739 $ 920 $300 $792 (58) 4,014
Less:Preferredstockdividends ............... 122 122
Operating earnings available to common
shareholders . . . . . . . . . . . . . . . . . . . . . . . . . . $(180) $3,892
Year Ended December 31, 2009
Insurance
Products Retirement
Products
Corporate
Benefit
Funding Auto &
Home International
Banking,
Corporate
&Other Total
(In millions)
Income (loss) from continuing operations, net of
income tax . . . . . . . . . . . . . . . . . . . . . . . . . . . $ (418) $ (628) $ (581) $321 $(280) $(733) $(2,319)
Less: Net investment gains (losses) . . . . . . . . . . . . . (472) (533) (1,486) (41) (105) (269) (2,906)
Less: Net derivative gains (losses) . . . . . . . . . . . . . (1,786) (1,426) (421) 39 (798) (474) (4,866)
Less: Adjustments to continuing operations(1) . . . . . . (139) 519 125 — (206) (16) 283
Less: Provision for income tax (expense) benefit . . . . 837 504 621 1 366 354 2,683
Operatingearnings ....................... $1,142 $ 308 $ 580 $322 $463 (328) 2,487
Less:Preferredstockdividends ............... 122 122
Operating earnings available to common
shareholders.......................... $(450) $2,365
(1) See definitions of operating revenues and operating expenses for the components of such adjustments.
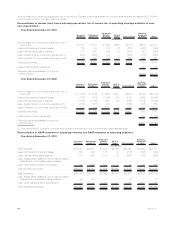
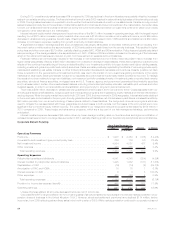
Reconciliation of GAAP revenues to operating revenues and GAAP expenses to operating expenses
Year Ended December 31, 2010
Insurance
Products Retirement
Products
Corporate
Benefit
Funding Auto &
Home International
Banking,
Corporate
&Other Total
(In millions)
Total revenues . . . . . . . . . . . . . . . . . . . . . . . . . $26,451 $6,881 $7,540 $3,146 $6,794 $1,905 $52,717
Less: Net investment gains (losses) . . . . . . . . . . . 103 139 176 (7) (273) (530) (392)
Less: Net derivative gains (losses) . . . . . . . . . . . . 215 266 (193) (1) (491) (61) (265)
Less: Adjustments related to net investment gains
(losses) and net derivative gains (losses) . . . . . . . 1 — — — — — 1
Less: Other adjustments to revenues(1) . . . . . . . . . (144) (248) 193 — 44 449 294
Total operating revenues . . . . . . . . . . . . . . . . . . $26,276 $6,724 $7,364 $3,154 $7,514 $2,047 $53,079
Total expenses . . . . . . . . . . . . . . . . . . . . . . . . . $24,338 $5,622 $5,999 $2,781 $6,987 $3,032 $48,759
Less: Adjustments related to net investment gains
(losses) and net derivative gains (losses) . . . . . . . 90 35 — — (7) — 118
Less: Other adjustments to expenses(1) . . . . . . . . 4 (1) 50 — 478 627 1,158
Total operating expenses . . . . . . . . . . . . . . . . . . $24,244 $5,588 $5,949 $2,781 $6,516 $2,405 $47,483
20 MetLife, Inc.