MetLife 2010 Annual Report Download - page 163
Download and view the complete annual report
Please find page 163 of the 2010 MetLife annual report below. You can navigate through the pages in the report by either clicking on the pages listed below, or by using the keyword search tool below to find specific information within the annual report.-
 1
1 -
2
-
3
-
4
-
5
-
6
-
7
-
8
-
9
-
10
-
11
-
12
-
13
-
14
-
15
-
16
-
17
-
18
-
19
-
20
-
21
-
22
-
23
-
24
-
25
-
26
-
27
-
28
-
29
-
30
-
31
-
32
-
33
-
34
-
35
-
36
-
37
-
38
-
39
-
40
-
41
-
42
-
43
-
44
-
45
-
46
-
47
-
48
-
49
-
50
-
51
-
52
-
53
-
54
-
55
-
56
-
57
-
58
-
59
-
60
-
61
-
62
-
63
-
64
-
65
-
66
-
67
-
68
-
69
-
70
-
71
-
72
-
73
-
74
-
75
-
76
-
77
-
78
-
79
-
80
-
81
-
82
-
83
-
84
-
85
-
86
-
87
-
88
-
89
-
90
-
91
-
92
-
93
-
94
-
95
-
96
-
97
-
98
-
99
-
100
-
101
-
102
-
103
-
104
-
105
-
106
-
107
-
108
-
109
-
110
-
111
-
112
-
113
-
114
-
115
-
116
-
117
-
118
-
119
-
120
-
121
-
122
-
123
-
124
-
125
-
126
-
127
-
128
-
129
-
130
-
131
-
132
-
133
-
134
-
135
-
136
-
137
-
138
-
139
-
140
-
141
-
142
-
143
-
144
-
145
-
146
-
147
-
148
-
149
-
150
-
151
-
152
-
 153
153 -
 154
154 -
 155
155 -
 156
156 -
 157
157 -
 158
158 -
 159
159 -
 160
160 -
 161
161 -
 162
162 -
 163
163 -
 164
164 -
 165
165 -
 166
166 -
 167
167 -
 168
168 -
 169
169 -
 170
170 -
 171
171 -
 172
172 -
 173
173 -
174
-
175
-
176
-
177
-
178
-
179
-
180
-
181
-
182
-
183
-
184
-
185
-
186
-
187
-
188
-
189
-
190
-
191
-
192
-
193
-
194
-
195
-
196
-
197
-
198
-
199
-
200
-
201
-
202
-
203
-
204
-
205
-
206
-
207
-
208
-
209
-
210
-
211
-
212
-
213
-
214
-
215
-
216
-
217
-
218
-
219
-
220
-
221
-
222
-
223
-
224
-
225
-
226
-
227
-
228
-
229
-
230
-
231
-
232
-
233
-
234
-
235
-
236
-
237
-
238
-
239
-
240
-
241
-
242
 |
 |

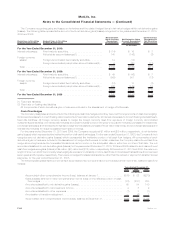
classification of the direct risk. The value of the embedded derivatives on the ceded risk is determined using a methodology consistent with
that described previously for the guarantees directly written by the Company.
As part of its regular review of critical accounting estimates, the Company periodically assesses inputs for estimating nonperformance risk
(commonly referred to as “own credit”) in fair value measurements. During the second quarter of 2010, the Company completed a study that
aggregated and evaluated data, including historical recovery rates of insurance companies, as well as policyholder behavior observed over
the past two years as the recent financial crisis evolved. As a result, at the end of the second quarter of 2010, the Company refined the way in
which its insurance subsidiaries incorporate expected recovery rates into the nonperformance risk adjustment for purposes of estimating the
fair value of investment-type contracts and embedded derivatives within insurance contracts. The Company recognized a loss of $577 mil-
lion, net of DAC and income tax, relating to implementing the refinement at June 30, 2010. The refinement reduced both basic and diluted net
income available to MetLife, Inc.’s common shareholders per common share by $0.65 for the year ended December 31, 2010.
The estimated fair value of the embedded derivatives within funds withheld related to certain ceded reinsurance is determined based on
the change in estimated fair value of the underlying assets held by the Company in a reference portfolio backing the funds withheld liability.
The estimated fair value of the underlying assets is determined as described above in “— Fixed Maturity Securities, Equity Securities, Trading
and Other Securities and Short-term Investments.” The estimated fair value of these embedded derivatives is included, along with their funds
withheld hosts, in other liabilities in the consolidated balance sheets with changes in estimated fair value recorded in net derivative gains
(losses). Changes in the credit spreads on the underlying assets, interest rates and market volatility may result in significant fluctuations in the
estimated fair value of these embedded derivatives that could materially affect net income.
The estimated fair value of the embedded equity and bond indexed derivatives contained in certain funding agreements is determined
using market standard swap valuation models and observable market inputs, including an adjustment for nonperformance risk. The estimated
fair value of these embedded derivatives are included, along with their funding agreements host, within policyholder account balances with
changes in estimated fair value recorded in net derivative gains (losses). Changes in equity and bond indices, interest rates and the
Company’s credit standing may result in significant fluctuations in the estimated fair value of these embedded derivatives that could materially
affect net income.
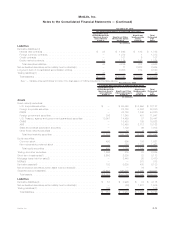
Separate Account Assets
Separate account assets are carried at estimated fair value and reported as a summarized total on the consolidated balance sheets. The
estimated fair value of separate account assets is based on the estimated fair value of the underlying assets owned by the separate account.
Assets within the Company’s separate accounts include: mutual funds, fixed maturity securities, equity securities, mortgage loans,
derivatives, hedge funds, other limited partnership interests, short-term investments and cash and cash equivalents. See “— Valuation
Techniques and Inputs by Level Within the Three-Level Fair Value Hierarchy by Major Classes of Assets and Liabilities” below for a discussion
of the methods and assumptions used to estimate the fair value of these financial instruments.
Long-term Debt of CSEs
The Company has elected the FVO for the long-term debt of CSEs, which are carried at estimated fair value. See “— Valuation Techniques
and Inputs by Level Within the Three-Level Fair Value Hierarchy by Major Classes of Assets and Liabilities” below for a discussion of the
methods and assumptions used to estimate the fair value of these financial instruments.
Trading Liabilities
Trading liabilities are recorded at estimated fair value with subsequent changes in estimated fair value recognized in net investment
income. The estimated fair value of trading liabilities is determined on a basis consistent with the methodologies described in “— Fixed
Maturity Securities, Equity Securities and Trading and Other Securities.”
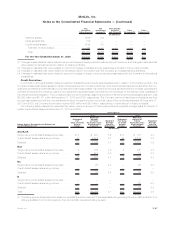
Valuation Techniques and Inputs by Level Within the Three-Level Fair Value Hierarchy by Major Classes of Assets and
Liabilities
A description of the significant valuation techniques and inputs to the determination of estimated fair value for the more significant asset
andliabilityclassesmeasuredatfairvalueonarecurringbasisisasfollows:
The Company determines the estimated fair value of its investments using primarily the market approach and the income approach. The
use of quoted prices for identical assets and matrix pricing or other similar techniques are examples of market approaches, while the use of
discounted cash flow methodologies is an example of the income approach. The Company attempts to maximize the use of observable inputs
and minimize the use of unobservable inputs in selecting whether the market or income approach is used.
While certain investments have been classified as Level 1 from the use of unadjusted quoted prices for identical investments supported by
high volumes of trading activity and narrow bid/ask spreads, most investments have been classified as Level 2 because the significant inputs
used to measure the fair value on a recurring basis of the same or similar investment are market observable or can be corroborated using
market observable information for the full term of the investment. Level 3 investments include those where estimated fair values are based on
significant unobservable inputs that are supported by little or no market activity and may reflect our own assumptions about what factors
market participants would use in pricing these investments.
Level 1 Measurements:
Fixed Maturity Securities, Equity Securities, Trading and Other Securities and Short-term Investments
These securities are comprised of U.S. Treasury, agency and government guaranteed fixed maturity securities, foreign government
securities, RMBS — principally to-be-announced securities, exchange traded common stock, exchange traded mutual fund interests
included in equity securities, exchange traded registered mutual fund interests included in trading and other securities and short-term money
market securities, including U.S. Treasury bills. Valuation of these securities is based on unadjusted quoted prices in active markets that are
readily and
F-74 MetLife, Inc.
MetLife, Inc.
Notes to the Consolidated Financial Statements — (Continued)