MetLife 2010 Annual Report Download - page 161
Download and view the complete annual report
Please find page 161 of the 2010 MetLife annual report below. You can navigate through the pages in the report by either clicking on the pages listed below, or by using the keyword search tool below to find specific information within the annual report.-
 1
1 -
2
-
3
-
4
-
5
-
6
-
7
-
8
-
9
-
10
-
11
-
12
-
13
-
14
-
15
-
16
-
17
-
18
-
19
-
20
-
21
-
22
-
23
-
24
-
25
-
26
-
27
-
28
-
29
-
30
-
31
-
32
-
33
-
34
-
35
-
36
-
37
-
38
-
39
-
40
-
41
-
42
-
43
-
44
-
45
-
46
-
47
-
48
-
49
-
50
-
51
-
52
-
53
-
54
-
55
-
56
-
57
-
58
-
59
-
60
-
61
-
62
-
63
-
64
-
65
-
66
-
67
-
68
-
69
-
70
-
71
-
72
-
73
-
74
-
75
-
76
-
77
-
78
-
79
-
80
-
81
-
82
-
83
-
84
-
85
-
86
-
87
-
88
-
89
-
90
-
91
-
92
-
93
-
94
-
95
-
96
-
97
-
98
-
99
-
100
-
101
-
102
-
103
-
104
-
105
-
106
-
107
-
108
-
109
-
110
-
111
-
112
-
113
-
114
-
115
-
116
-
117
-
118
-
119
-
120
-
121
-
122
-
123
-
124
-
125
-
126
-
127
-
128
-
129
-
130
-
131
-
132
-
133
-
134
-
135
-
136
-
137
-
138
-
139
-
140
-
141
-
142
-
143
-
144
-
145
-
146
-
147
-
148
-
149
-
150
-
 151
151 -
 152
152 -
 153
153 -
 154
154 -
 155
155 -
 156
156 -
 157
157 -
 158
158 -
 159
159 -
 160
160 -
 161
161 -
 162
162 -
 163
163 -
 164
164 -
 165
165 -
 166
166 -
 167
167 -
 168
168 -
 169
169 -
 170
170 -
 171
171 -
172
-
173
-
174
-
175
-
176
-
177
-
178
-
179
-
180
-
181
-
182
-
183
-
184
-
185
-
186
-
187
-
188
-
189
-
190
-
191
-
192
-
193
-
194
-
195
-
196
-
197
-
198
-
199
-
200
-
201
-
202
-
203
-
204
-
205
-
206
-
207
-
208
-
209
-
210
-
211
-
212
-
213
-
214
-
215
-
216
-
217
-
218
-
219
-
220
-
221
-
222
-
223
-
224
-
225
-
226
-
227
-
228
-
229
-
230
-
231
-
232
-
233
-
234
-
235
-
236
-
237
-
238
-
239
-
240
-
241
-
242
 |
 |

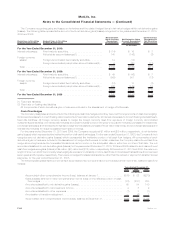
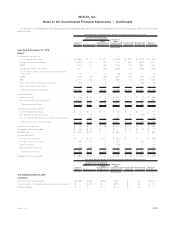
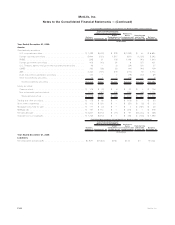
(1) Short-term investments as presented in the tables above differ from the amounts presented in the consolidated balance sheets because
certain short-term investments are not measured at estimated fair value (e.g., time deposits, etc.), and therefore are excluded from the
tables presented above.
(2) Mortgage loans held-for-sale as presented in the tables above differ from the amount presented in the consolidated balance sheets as
these tables only include residential mortgage loans held-for-sale measured at estimated fair value on a recurring basis.
(3) MSRs are presented within other invested assets in the consolidated balance sheets.
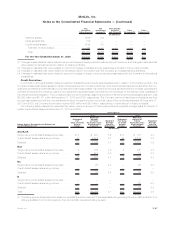
(4) Derivative assets are presented within other invested assets in the consolidated balance sheets and derivative liabilities are presented
within other liabilities in the consolidated balance sheets. The amounts are presented gross in the tables above to reflect the presentation
in the consolidated balance sheets, but are presented net for purposes of the rollforward in the Fair Value Measurements Using Significant
Unobservable Inputs (Level 3) tables which follow. At December 31, 2010 and 2009, certain non-derivative hedging instruments of
$185 million and $0, respectively, which are carried at amortized cost, are included with the liabilities total in Note 4 but excluded from
derivative liabilities in the tables above as they are not derivative instruments.
(5) Net embedded derivatives within asset host contracts are presented within premiums, reinsurance and other receivables in the
consolidated balance sheets. Net embedded derivatives within liability host contracts are presented primarily within policyholder
account balances in the consolidated balance sheets. At December 31, 2010, fixed maturity securities and equity securities also
included embedded derivatives of $5 million and ($62) million, respectively. At December 31, 2009, fixed maturity securities and equity
securities included embedded derivatives of $0 and ($37) million, respectively.
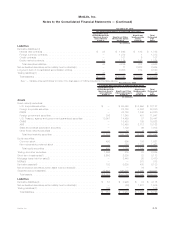
(6) Separate account assets are measured at estimated fair value. Investment performance related to separate account assets is fully offset
by corresponding amounts credited to contractholders whose liability is reflected within separate account liabilities. Separate account
liabilities are set equal to the estimated fair value of separate account assets.
(7) Trading liabilities are presented within other liabilities in the consolidated balance sheets.
The methods and assumptions used to estimate the fair value of financial instruments are summarized as follows:
Fixed Maturity Securities, Equity Securities, Trading and Other Securities and Short-term Investments
When available, the estimated fair value of the Company’s fixed maturity, equity and trading and other securities are based on quoted
prices in active markets that are readily and regularly obtainable. Generally, these are the most liquid of the Company’s securities holdings and
valuation of these securities does not involve management judgment.
When quoted prices in active markets are not available, the determination of estimated fair value is based on market standard valuation
methodologies. The market standard valuation methodologies utilized include: discounted cash flow methodologies, matrix pricing or other
similar techniques. The inputs in applying these market standard valuation methodologies include, but are not limited to: interest rates, credit
standing of the issuer or counterparty, industry sector of the issuer, coupon rate, call provisions, sinking fund requirements, maturity and
management’s assumptions regarding estimated duration, liquidity and estimated future cash flows. Accordingly, the estimated fair values
are based on available market information and management’s judgments about financial instruments.
The significant inputs to the market standard valuation methodologies for certain types of securities with reasonable levels of price
transparency are inputs that are observable in the market or can be derived principally from or corroborated by observable market data. Such
observable inputs include benchmarking prices for similar assets in active markets, quoted prices in markets that are not active and
observable yields and spreads in the market.
When observable inputs are not available, the market standard valuation methodologies for determining the estimated fair value of certain
types of securities that trade infrequently, and therefore have little or no price transparency, rely on inputs that are significant to the estimated
fair value that are not observable in the market or cannot be derived principally from or corroborated by observable market data. These
unobservable inputs can be based in large part on management judgment or estimation and cannot be supported by reference to market
activity. Even though unobservable, these inputs are assumed to be consistent with what other market participants would use when pricing
such securities and are considered appropriate given the circumstances.
The estimated fair value of FVO securities held by CSEs is determined on a basis consistent with the methodologies described herein for
fixed maturity securities and equity securities. As discussed in Note 1, the Company adopted new guidance effective January 1, 2010 and
consolidated certain securitization entities that hold securities that have been accounted for under the FVO and classified within trading and
other securities.
The use of different methodologies, assumptions and inputs may have a material effect on the estimated fair values of the Company’s
securities holdings.
Mortgage Loans
Mortgage loans presented in the tables above consist of commercial mortgage loans held by CSEs and residential mortgage loans
held-for-sale for which the Company has elected the FVO and which are carried at estimated fair value. As discussed in Note 1, the Company
adopted new guidance effective January 1, 2010 and consolidated certain securitization entities that hold commercial mortgage loans. See
“— Valuation Techniques and Inputs by Level Within the Three-Level Fair Value Hierarchy by Major Classes of Assets and Liabilities” below for
a discussion of the methods and assumptions used to estimate the fair value of these financial instruments.
MSRs
Although MSRs are not financial instruments, the Company has included them in the preceding table as a result of its election to carry
MSRs at estimated fair value. See “— Valuation Techniques and Inputs by Level Within the Three-Level Fair Value Hierarchy by Major Classes
of Assets and Liabilities” below for a discussion of the methods and assumptions used to estimate the fair value of these financial instruments.
F-72 MetLife, Inc.
MetLife, Inc.
Notes to the Consolidated Financial Statements — (Continued)