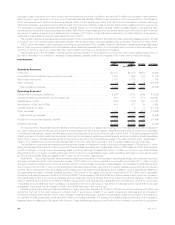
MetLife 2010 Annual Report Download - page 48
Download and view the complete annual report
Please find page 48 of the 2010 MetLife annual report below. You can navigate through the pages in the report by either clicking on the pages listed below, or by using the keyword search tool below to find specific information within the annual report.-
 1
1 -
2
-
3
-
4
-
5
-
6
-
7
-
8
-
9
-
10
-
11
-
12
-
13
-
14
-
15
-
16
-
17
-
18
-
19
-
20
-
21
-
22
-
23
-
24
-
25
-
26
-
27
-
28
-
29
-
30
-
31
-
32
-
33
-
34
-
35
-
36
-
37
-
 38
38 -
 39
39 -
 40
40 -
 41
41 -
 42
42 -
 43
43 -
 44
44 -
 45
45 -
 46
46 -
 47
47 -
 48
48 -
 49
49 -
 50
50 -
 51
51 -
 52
52 -
 53
53 -
 54
54 -
 55
55 -
 56
56 -
 57
57 -
 58
58 -
59
-
60
-
61
-
62
-
63
-
64
-
65
-
66
-
67
-
68
-
69
-
70
-
71
-
72
-
73
-
74
-
75
-
76
-
77
-
78
-
79
-
80
-
81
-
82
-
83
-
84
-
85
-
86
-
87
-
88
-
89
-
90
-
91
-
92
-
93
-
94
-
95
-
96
-
97
-
98
-
99
-
100
-
101
-
102
-
103
-
104
-
105
-
106
-
107
-
108
-
109
-
110
-
111
-
112
-
113
-
114
-
115
-
116
-
117
-
118
-
119
-
120
-
121
-
122
-
123
-
124
-
125
-
126
-
127
-
128
-
129
-
130
-
131
-
132
-
133
-
134
-
135
-
136
-
137
-
138
-
139
-
140
-
141
-
142
-
143
-
144
-
145
-
146
-
147
-
148
-
149
-
150
-
151
-
152
-
153
-
154
-
155
-
156
-
157
-
158
-
159
-
160
-
161
-
162
-
163
-
164
-
165
-
166
-
167
-
168
-
169
-
170
-
171
-
172
-
173
-
174
-
175
-
176
-
177
-
178
-
179
-
180
-
181
-
182
-
183
-
184
-
185
-
186
-
187
-
188
-
189
-
190
-
191
-
192
-
193
-
194
-
195
-
196
-
197
-
198
-
199
-
200
-
201
-
202
-
203
-
204
-
205
-
206
-
207
-
208
-
209
-
210
-
211
-
212
-
213
-
214
-
215
-
216
-
217
-
218
-
219
-
220
-
221
-
222
-
223
-
224
-
225
-
226
-
227
-
228
-
229
-
230
-
231
-
232
-
233
-
234
-
235
-
236
-
237
-
238
-
239
-
240
-
241
-
242
 |
 |

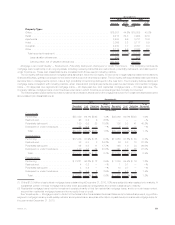
A rollforward of the fair value measurements for fixed maturity securities and equity securities available-for-sale measured at estimated fair
value on a recurring basis using significant unobservable (Level 3) inputs is as follows:
Fixed Maturity
Securities Equity
Securities
Year Ended
December 31, 2010
(In millions)
Balance,beginningofyear................................................ $17,190 $1,240
Total realized/unrealized gains (losses) included in:
Earnings .......................................................... (39) 51
Othercomprehensiveincome(loss)......................................... 1,072 19
Purchases,sales,issuancesandsettlements(1) .................................. 4,519 (122)
Transfersintoand/oroutofLevel3........................................... 53 (15)
Balance,endofyear.................................................... $22,795 $1,173
(1) Includes securities acquired from ALICO of $5,435 million for fixed maturity securities and $68 million for equity securities.
An analysis of transfers into and/or out of Level 3 for the year ended December 31, 2010 is as follows:
• Total gains and losses in earnings and other comprehensive income (loss) are calculated assuming transfers in or out of Level 3
occurred at the beginning of the period. Items transferred in and out for the same period are excluded from the rollforward.
• Total gains and losses for fixed maturity securities included in earnings of ($2) million and other comprehensive income (loss) of
$19 million respectively, were incurred for transfers subsequent to their transfer to Level 3, for the year ended December 31, 2010.
• Net transfers into and/or out of Level 3 for fixed maturity securities were $53 million for the year ended December 31, 2010, and were
comprised of transfers in of $1,736 million and transfers out of ($1,683) million, respectively.
Overall, transfers into and/or out of Level 3 are attributable to a change in the observability of inputs. Assets and liabilities are transferred
into Level 3 when a significant input cannot be corroborated with market observable data. This occurs when market activity decreases
significantly and underlying inputs cannot be observed, current prices are not available, and when there are significant variances in quoted
prices, thereby affecting transparency. Assets and liabilities are transferred out of Level 3 when circumstances change such that a significant
input can be corroborated with market observable data. This may be due to a significant increase in market activity, a specific event, or one or
more significant input(s) becoming observable. Transfers into and/or out of any level are assumed to occur at the beginning of the period.
Significant transfers in and/or out of Level 3 assets and liabilities for the year ended December 31, 2010 are summarized below.
• During the year ended December 31, 2010, fixed maturity securities transfers into Level 3 of $1,736 million resulted primarily from
current market conditions characterized by a lack of trading activity, decreased liquidity and credit ratings downgrades (e.g., from
investment grade to below investment grade). These current market conditions have resulted in decreased transparency of valuations
and an increased use of broker quotations and unobservable inputs to determine estimated fair value principally for certain private
placements included in U.S. and foreign corporate securities and certain CMBS.
• During the year ended December 31, 2010, fixed maturity securities transfers out of Level 3 of ($1,683) million resulted primarily from
increased transparency of both new issuances that subsequent to issuance and establishment of trading activity, became priced by
independent pricing services and existing issuances that, over time, the Company was able to corroborate pricing received from
independent pricing services with observable inputs, or there were increases in market activity and upgraded credit ratings primarily for
certain U.S. and foreign corporate securities, RMBS and ABS.
See “— Summary of Critical Accounting Estimates — Estimated Fair Value of Investments” for further information on the estimates and
assumptions that affect the amounts reported above.
See “— Fair Value — Assets and Liabilities Measured at Fair Value — Recurring Fair Value Measurements — Valuation Techniques and
Inputs by Level Within the Three-Level Fair Value Hierarchy by Major Classes of Assets and Liabilities” in Note 5 for further information about
the valuation techniques and inputs by level by major classes of invested assets that affect the amounts reported above.
Fixed Maturity Securities Credit Quality — Ratings. The Securities Valuation Office of the National Association of Insurance Commis-
sioners (“NAIC”) evaluates the fixed maturity security investments of insurers for regulatory reporting and capital assessment purposes and
assigns securities to one of six credit quality categories called “NAIC designations.” If no rating is available from the NAIC, then as permitted by
the NAIC, an internally developed rating is used. The NAIC ratings are generally similar to the credit quality designations of the Nationally
Recognized Statistical Ratings Organizations (“NRSROs”) for marketable fixed maturity securities, called “rating agency designations,” except
for certain structured securities as described below. NAIC ratings 1 and 2 include fixed maturity securities generally considered investment
grade (i.e., rated “Baa3” or better by Moody’s Investors Service (“Moody’s”) or rated “BBB” or better by S&P and Fitch Ratings (“Fitch”)) by such
rating organizations. NAIC ratings 3 through 6 include fixed maturity securities generally considered below investment grade (i.e., rated “Ba1”
or lower by Moody’s or rated “BB+” or lower by S&P and Fitch) by such rating organizations.
The NAIC adopted revised rating methodologies for non-agency RMBS, including RMBS backed by sub-prime mortgage loans reported
within ABS, that became effective December 31, 2009 and for CMBS and all other ABS that became effective December 31, 2010. The
NAIC’s objective with the revised rating methodologies for these structured securities was to increase the accuracy in assessing expected
losses, and to use the improved assessment to determine a more appropriate capital requirement for such structured securities. The revised
methodologies reduce regulatory reliance on rating agencies and allow for greater regulatory input into the assumptions used to estimate
expected losses from such structured securities.
The three tables below present fixed maturity securities based on rating agency designations and equivalent designations of the NAIC,
with the exception of certain structured securities held by the Company’s insurance subsidiaries that file NAIC statutory financial statements.
Non-agency RMBS, including RMBS backed by sub-prime mortgage loans reported within ABS, CMBS and all other ABS held by the
Company’s insurance subsidiaries that file NAIC statutory financial statements are presented based on final ratings from the revised NAIC
rating methodologies described above (which may not correspond to rating agency designations). All NAIC designation (e.g., NAIC
1) amounts and percentages presented herein are based on the revised NAIC methodologies described above. All rating agency designation
45MetLife, Inc.