MetLife 2010 Annual Report Download - page 22
Download and view the complete annual report
Please find page 22 of the 2010 MetLife annual report below. You can navigate through the pages in the report by either clicking on the pages listed below, or by using the keyword search tool below to find specific information within the annual report.-
 1
1 -
2
-
3
-
4
-
5
-
6
-
7
-
8
-
9
-
10
-
11
-
 12
12 -
 13
13 -
 14
14 -
 15
15 -
 16
16 -
 17
17 -
 18
18 -
 19
19 -
 20
20 -
 21
21 -
 22
22 -
 23
23 -
 24
24 -
 25
25 -
 26
26 -
 27
27 -
 28
28 -
 29
29 -
 30
30 -
 31
31 -
 32
32 -
33
-
34
-
35
-
36
-
37
-
38
-
39
-
40
-
41
-
42
-
43
-
44
-
45
-
46
-
47
-
48
-
49
-
50
-
51
-
52
-
53
-
54
-
55
-
56
-
57
-
58
-
59
-
60
-
61
-
62
-
63
-
64
-
65
-
66
-
67
-
68
-
69
-
70
-
71
-
72
-
73
-
74
-
75
-
76
-
77
-
78
-
79
-
80
-
81
-
82
-
83
-
84
-
85
-
86
-
87
-
88
-
89
-
90
-
91
-
92
-
93
-
94
-
95
-
96
-
97
-
98
-
99
-
100
-
101
-
102
-
103
-
104
-
105
-
106
-
107
-
108
-
109
-
110
-
111
-
112
-
113
-
114
-
115
-
116
-
117
-
118
-
119
-
120
-
121
-
122
-
123
-
124
-
125
-
126
-
127
-
128
-
129
-
130
-
131
-
132
-
133
-
134
-
135
-
136
-
137
-
138
-
139
-
140
-
141
-
142
-
143
-
144
-
145
-
146
-
147
-
148
-
149
-
150
-
151
-
152
-
153
-
154
-
155
-
156
-
157
-
158
-
159
-
160
-
161
-
162
-
163
-
164
-
165
-
166
-
167
-
168
-
169
-
170
-
171
-
172
-
173
-
174
-
175
-
176
-
177
-
178
-
179
-
180
-
181
-
182
-
183
-
184
-
185
-
186
-
187
-
188
-
189
-
190
-
191
-
192
-
193
-
194
-
195
-
196
-
197
-
198
-
199
-
200
-
201
-
202
-
203
-
204
-
205
-
206
-
207
-
208
-
209
-
210
-
211
-
212
-
213
-
214
-
215
-
216
-
217
-
218
-
219
-
220
-
221
-
222
-
223
-
224
-
225
-
226
-
227
-
228
-
229
-
230
-
231
-
232
-
233
-
234
-
235
-
236
-
237
-
238
-
239
-
240
-
241
-
242
 |
 |
opportunity for long-term yield enhancement in addition to supporting the cash flow and duration objectives of our investment portfolio. We
also use derivatives as an integral part of our management of the investment portfolio to hedge certain risks, including changes in interest
rates, foreign currencies, credit spreads and equity market levels. Additional considerations for our investment portfolio include current and
expected market conditions and expectations for changes within our specific mix of products and business segments. In addition, the general
account investment portfolio includes within trading and other securities, contractholder-directed investments supporting unit-linked variable
annuity type liabilities, which do not qualify for reporting and presentation as separate account assets. The returns on these investments,
which can vary significantly period to period include changes in estimated fair value subsequent to purchase, inure to contractholders and are
offset in earnings by a corresponding change in policyholder account balances through interest credited to policyholder account balances.
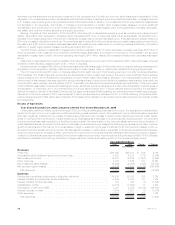
The composition of the investment portfolio of each business segment is tailored to the specific characteristics of its insurance liabilities,
causing certain portfolios to be shorter in duration and others to be longer in duration. Accordingly, certain portfolios are more heavily
weighted in longer duration, higher yielding fixed maturity securities, or certain sub-sectors of fixed maturity securities, than other portfolios.
Investments are purchased to support our insurance liabilities and not to generate net investment gains and losses. However, net
investment gains and losses are generated and can change significantly from period to period, due to changes in external influences,
including movements in interest rates, foreign currencies, credit spreads and equity markets, counterparty specific factors such as financial
performance, credit rating and collateral valuation, and internal factors such as portfolio rebalancing, that can generate gains and losses. As
an investor in the fixed income, equity security, mortgage loan and certain other invested asset classes, we are exposed to the above stated
risks, which can lead to both impairments and credit-related losses.
Freestanding derivatives are used to hedge certain investments and liabilities. For those hedges not designated as accounting hedges,
changes in these market risks can lead to the recognition of fair value changes in net derivative gains (losses) without an offsetting gain or loss
recognized in earnings for the item being hedged even though these are effective economic hedges. Additionally, we issue liabilities and
purchase assets that contain embedded derivatives whose changes in estimated fair value are sensitive to changes in market risks and are
also recognized in net derivative gains (losses).
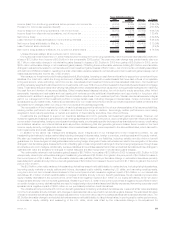
The favorable variance in net derivative gains (losses) of $3.0 billion, from losses of $3.2 billion in 2009 to losses of $172 million in 2010
was primarily driven by a favorable change in freestanding derivatives of $4.4 billion, comprised of a $4.5 billion favorable change from losses
in the prior year of $4.3 billion to gains in the current year of $203 million and $123 million in ALICO freestanding derivative losses. This
favorable variance was partially offset by an unfavorable change in embedded derivatives primarily associated with variable annuity minimum
benefit guarantees of $1.4 billion from gains in the prior year of $1.1 billion to losses in the current year of $257 million, net of $5 million in
ALICO embedded derivative gains.
We use freestanding interest rate, currency, credit and equity derivatives to provide economic hedges of certain invested assets and
insurance liabilities, including embedded derivatives, within certain of our variable annuity minimum benefit guarantees. The $4.5 billion
favorable variance in freestanding derivatives was primarily attributable to market factors, including falling long-term and mid-term interest
rates, a stronger recovery in equity markets in the prior year than the current year, a greater decrease in equity volatility in the prior year as
compared to the current year, a strengthening U.S. dollar and widening corporate credit spreads in the financial services sector. Falling long-
term and mid-term interest rates in the current year compared to rising long-term and mid-term interest rates in the prior year had a positive
impact of $2.6 billion on our interest rate derivatives, $931 million of which is attributable to hedges of variable annuity minimum benefit
guarantee liabilities, which are accounted for as embedded derivatives. In addition, stronger equity market recovery and lower equity market
volatility in the prior year as compared to the current year had a positive impact of $1.1 billion on our equity derivatives, which we use to hedge
variable annuity minimum benefit guarantees. U.S. dollar strengthening had a positive impact of $554 million on certain of our foreign currency
derivatives, which are used to hedge foreign-denominated asset and liability exposures. Finally, widening corporate credit spreads in the
financial services sector had a positive impact of $221 million on our purchased protection credit derivatives.
Certain variable annuity products with minimum benefit guarantees contain embedded derivatives that are measured at estimated fair
value separately from the host variable annuity contract, with changes in estimated fair value reported in net derivative gains (losses). These
embedded derivatives also include an adjustment for nonperformance risk of the related liabilities carried at estimated fair value. The
$1.4 billion unfavorable change in embedded derivatives was primarily attributable to the impact of market factors, including falling long-term
and mid-term interest rates, changes in foreign currency exchange rates, equity volatility and equity market movements. Falling long-term and
mid-term interest rates in the current year compared to rising long-term and mid-term interest rates in the prior year had a negative impact of
$1.4 billion. Changes in foreign currency exchange rates had a negative impact of $468 million. Equity volatility decreased more in the prior
year than in the current year causing a negative impact of $284 million, and a stronger recovery in the equity markets in the prior year than in
the current year had a negative impact of $228 million. The unfavorable impact from these hedged risks was partially offset by a favorable
change related to the adjustment for nonperformance risk of $1.2 billion, from losses of $1.3 billion in 2009 to losses of $62 million in 2010.
This $62 million loss was net of a $621 million loss related to a refinement in estimating the spreads used in the adjustment for
nonperformance risk made in the second quarter of 2010. Gains on the freestanding derivatives that hedged these embedded derivative
risks largely offset the change in liabilities attributable to market factors, excluding the adjustment for nonperformance risk, which does not
have an economic impact on the Company.
Improved or stabilizing market conditions across several invested asset classes and sectors as compared to the prior year resulted in
decreases in impairments and in net realized losses from sales and disposals of investments in most components of our investment portfolio.
These decreases, coupled with a decrease in the provision for credit losses on mortgage loans due to improved market conditions, resulted in
a $1.6 billion improvement in net investment gains (losses).
Income from continuing operations, net of income tax for 2010 includes $138 million of expenses related to the acquisition and integration
of ALICO. These expenses, which primarily consisted of investment banking and legal fees, are recorded in Banking, Corporate & Other and
are not a component of operating earnings.
As more fully described in the discussion of performance measures above, we use operating earnings, which does not equate to income
(loss) from continuing operations as determined in accordance with GAAP, to analyze our performance, evaluate segment performance, and
allocate resources. Operating earnings is also a measure by which senior management’s and many other employees’ performance is
evaluated for the purpose of determining their compensation under applicable compensation plans. We believe that the presentation of
operating earnings, as we measure it for management purposes, enhances the understanding of our performance by highlighting the results
of operations and the underlying profitability drivers of the business. Operating earnings should not be viewed as a substitute for GAAP
19MetLife, Inc.