MetLife 2010 Annual Report Download - page 45
Download and view the complete annual report
Please find page 45 of the 2010 MetLife annual report below. You can navigate through the pages in the report by either clicking on the pages listed below, or by using the keyword search tool below to find specific information within the annual report.-
 1
1 -
2
-
3
-
4
-
5
-
6
-
7
-
8
-
9
-
10
-
11
-
12
-
13
-
14
-
15
-
16
-
17
-
18
-
19
-
20
-
21
-
22
-
23
-
24
-
25
-
26
-
27
-
28
-
29
-
30
-
31
-
32
-
33
-
34
-
 35
35 -
 36
36 -
 37
37 -
 38
38 -
 39
39 -
 40
40 -
 41
41 -
 42
42 -
 43
43 -
 44
44 -
 45
45 -
 46
46 -
 47
47 -
 48
48 -
 49
49 -
 50
50 -
 51
51 -
 52
52 -
 53
53 -
 54
54 -
 55
55 -
56
-
57
-
58
-
59
-
60
-
61
-
62
-
63
-
64
-
65
-
66
-
67
-
68
-
69
-
70
-
71
-
72
-
73
-
74
-
75
-
76
-
77
-
78
-
79
-
80
-
81
-
82
-
83
-
84
-
85
-
86
-
87
-
88
-
89
-
90
-
91
-
92
-
93
-
94
-
95
-
96
-
97
-
98
-
99
-
100
-
101
-
102
-
103
-
104
-
105
-
106
-
107
-
108
-
109
-
110
-
111
-
112
-
113
-
114
-
115
-
116
-
117
-
118
-
119
-
120
-
121
-
122
-
123
-
124
-
125
-
126
-
127
-
128
-
129
-
130
-
131
-
132
-
133
-
134
-
135
-
136
-
137
-
138
-
139
-
140
-
141
-
142
-
143
-
144
-
145
-
146
-
147
-
148
-
149
-
150
-
151
-
152
-
153
-
154
-
155
-
156
-
157
-
158
-
159
-
160
-
161
-
162
-
163
-
164
-
165
-
166
-
167
-
168
-
169
-
170
-
171
-
172
-
173
-
174
-
175
-
176
-
177
-
178
-
179
-
180
-
181
-
182
-
183
-
184
-
185
-
186
-
187
-
188
-
189
-
190
-
191
-
192
-
193
-
194
-
195
-
196
-
197
-
198
-
199
-
200
-
201
-
202
-
203
-
204
-
205
-
206
-
207
-
208
-
209
-
210
-
211
-
212
-
213
-
214
-
215
-
216
-
217
-
218
-
219
-
220
-
221
-
222
-
223
-
224
-
225
-
226
-
227
-
228
-
229
-
230
-
231
-
232
-
233
-
234
-
235
-
236
-
237
-
238
-
239
-
240
-
241
-
242
 |
 |

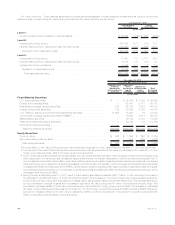
2010 2009 2008
Years Ended December 31,
(In millions)
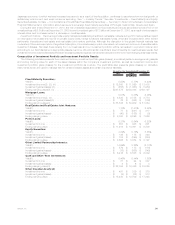
Investmentportfoliogains(losses)—intheaboveyieldtable................... $ (193) $(3,042) $(2,175)
Real estate discontinued operations — deduct from net investment gains (losses) . . . . (14) (8) (8)
Investment gains (losses) related to CSEs — add to net investment gains (losses) . . . . 6 — —
Purchased credit default swaps that offset losses incurred on certain fixed maturity
securities—deductfromnetinvestmentgains(losses).................... — — (183)
Othergains(losses)—addtonetinvestmentgains(losses).................. (191) 144 268
Net investment gains (losses) — GAAP consolidated statements of operations . . . . . . . $ (392) $ (2,906) $ (2,098)
Derivativegains(losses)—intheaboveyieldtable ......................... $ (614) $(5,106) $ 3,782
Scheduled periodic settlement payments on derivatives not qualifying for hedge
accounting — add to net derivative gains (losses), deduct from net investment
income................................................... 208 88 5
Scheduled periodic settlement payments on derivatives not qualifying for hedge
accounting — add to net derivative gains (losses), deduct from interest credited to
PABs .................................................... 11 (4) 45
Purchased credit default swaps that offset losses incurred on certain fixed maturity
securities—addtonetderivativegains(losses) ........................ — — 183
Equity method operating joint ventures — add to net investment income, deduct from
netderivativegains(losses) ..................................... 130 156 (105)
Net derivative gains (losses) — GAAP consolidated statements of operations . . . . . . . . $ (265) $ (4,866) $ 3,910
See “— Results of Operations — Year Ended December 31, 2010 compared with the Year Ended December 31, 2009 and Year Ended
December 31, 2009 compared with the Year Ended December 31, 2008,” for an analysis of the year over year changes in net investment
income and net investment gains (losses) and net derivative gains (losses).
Fixed Maturity and Equity Securities Available-for-Sale
Fixed maturity securities, which consisted principally of publicly-traded and privately placed fixed maturity securities, were $327.3 billion
and $227.6 billion, or 69% and 67% of total cash and invested assets at estimated fair value, at December 31, 2010 and 2009, respectively.
Publicly-traded fixed maturity securities represented $286.5 billion and $191.4 billion, or 88% and 84% of total fixed maturity securities at
estimated fair value, at December 31, 2010 and 2009, respectively. Privately placed fixed maturity securities represented $40.8 billion and
$36.2 billion, or 12% and 16% of total fixed maturity securities at estimated fair value, at December 31, 2010 and 2009, respectively.
Equity securities, which consisted principally of publicly-traded and privately-held common and preferred stocks, including certain
perpetual hybrid securities and mutual fund interests, were $3.6 billion and $3.1 billion, or 0.8% and 0.9% of total cash and invested assets at
estimated fair value, at December 31, 2010 and 2009, respectively. Publicly-traded equity securities represented $2.3 billion and $2.1 billion,
or 64% and 68% of total equity securities at estimated fair value, at December 31, 2010 and 2009, respectively. Privately-held equity
securities represented $1.3 billion and $1.0 billion, or 36% and 32% of total equity securities at estimated fair value, at December 31, 2010
and 2009, respectively.
Valuation of Securities. We are responsible for the determination of estimated fair value. The estimated fair value of publicly-traded fixed
maturity, equity and trading and other securities, as well as short-term securities is determined by management after considering one of three
primary sources of information: quoted market prices in active markets, independent pricing services, or independent broker quotations. The
number of quotes obtained varies by instrument and depends on the liquidity of the particular instrument. Generally, we obtain prices from
multiple pricing services to cover all asset classes and obtain multiple prices for certain securities, but ultimately utilize the price with the
highest placement in the fair value hierarchy. Independent pricing services that value these instruments use market standard valuation
methodologies based on inputs that are market observable or can be derived principally from or corroborated by observable market data.
Such observable inputs include benchmarking prices for similar assets in active, liquid markets, quoted prices in markets that are not active
and observable yields and spreads in the market. The market standard valuation methodologies utilized include: discounted cash flow
methodologies, matrix pricing or similar techniques. The assumptions and inputs in applying these market standard valuation methodologies
include, but are not limited to, interest rates, credit standing of the issuer or counterparty, industry sector of the issuer, coupon rate, call
provisions, sinking fund requirements, maturity, estimated duration, and management’s assumptions regarding liquidity and estimated future
cash flows. When a price is not available in the active market or through an independent pricing service, management will value the security
primarily using independent non-binding broker quotations. Independent non-binding broker quotations utilize inputs that are not market
observable or cannot be derived principally from or corroborated by observable market data.
Senior management, independent of the trading and investing functions, is responsible for the oversight of control systems and valuation
policies, including reviewing and approving new transaction types and markets, for ensuring that observable market prices and market-based
parameters are used for valuation, wherever possible, and for determining that judgmental valuation adjustments, if any, are based upon
established policies and are applied consistently over time. We review our valuation methodologies on an ongoing basis and ensure that any
changes to valuation methodologies are justified. We gain assurance on the overall reasonableness and consistent application of input
assumptions, valuation methodologies and compliance with accounting standards for fair value determination through various controls
designed to ensure that the financial assets and financial liabilities are appropriately valued and represent an exit price. The control systems
and procedures include, but are not limited to, analysis of portfolio returns to corresponding benchmark returns, comparing a sample of
executed prices of securities sold to the fair value estimates, comparing fair value estimates to management’s knowledge of the current
market, reviewing the bid/ask spreads to assess activity and ongoing confirmation that independent pricing services use, wherever possible,
42 MetLife, Inc.