MetLife 2010 Annual Report Download - page 126
Download and view the complete annual report
Please find page 126 of the 2010 MetLife annual report below. You can navigate through the pages in the report by either clicking on the pages listed below, or by using the keyword search tool below to find specific information within the annual report.-
 1
1 -
2
-
3
-
4
-
5
-
6
-
7
-
8
-
9
-
10
-
11
-
12
-
13
-
14
-
15
-
16
-
17
-
18
-
19
-
20
-
21
-
22
-
23
-
24
-
25
-
26
-
27
-
28
-
29
-
30
-
31
-
32
-
33
-
34
-
35
-
36
-
37
-
38
-
39
-
40
-
41
-
42
-
43
-
44
-
45
-
46
-
47
-
48
-
49
-
50
-
51
-
52
-
53
-
54
-
55
-
56
-
57
-
58
-
59
-
60
-
61
-
62
-
63
-
64
-
65
-
66
-
67
-
68
-
69
-
70
-
71
-
72
-
73
-
74
-
75
-
76
-
77
-
78
-
79
-
80
-
81
-
82
-
83
-
84
-
85
-
86
-
87
-
88
-
89
-
90
-
91
-
92
-
93
-
94
-
95
-
96
-
97
-
98
-
99
-
100
-
101
-
102
-
103
-
104
-
105
-
106
-
107
-
108
-
109
-
110
-
111
-
112
-
113
-
114
-
115
-
 116
116 -
 117
117 -
 118
118 -
 119
119 -
 120
120 -
 121
121 -
 122
122 -
 123
123 -
 124
124 -
 125
125 -
 126
126 -
 127
127 -
 128
128 -
 129
129 -
 130
130 -
 131
131 -
 132
132 -
 133
133 -
 134
134 -
 135
135 -
 136
136 -
137
-
138
-
139
-
140
-
141
-
142
-
143
-
144
-
145
-
146
-
147
-
148
-
149
-
150
-
151
-
152
-
153
-
154
-
155
-
156
-
157
-
158
-
159
-
160
-
161
-
162
-
163
-
164
-
165
-
166
-
167
-
168
-
169
-
170
-
171
-
172
-
173
-
174
-
175
-
176
-
177
-
178
-
179
-
180
-
181
-
182
-
183
-
184
-
185
-
186
-
187
-
188
-
189
-
190
-
191
-
192
-
193
-
194
-
195
-
196
-
197
-
198
-
199
-
200
-
201
-
202
-
203
-
204
-
205
-
206
-
207
-
208
-
209
-
210
-
211
-
212
-
213
-
214
-
215
-
216
-
217
-
218
-
219
-
220
-
221
-
222
-
223
-
224
-
225
-
226
-
227
-
228
-
229
-
230
-
231
-
232
-
233
-
234
-
235
-
236
-
237
-
238
-
239
-
240
-
241
-
242
 |
 |

Estimated
Fair
Value %ofTotal
Investments
Estimated
Fair
Value %ofTotal
Investments
2010 2009
December 31,
(In millions)
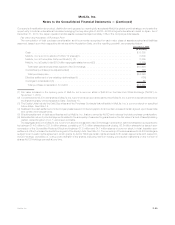
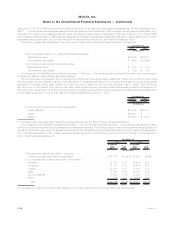
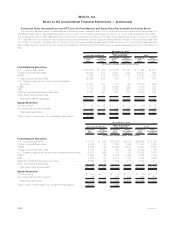
Concentrations within corporate fixed maturity securities:
Largestexposuretoasingleissuer ..................... $ 2,291 0.5% $1,038 0.3%
Holdings in ten issuers with the largest exposures . . . . . . . . . . . . $14,247 3.1% $7,506 2.3%
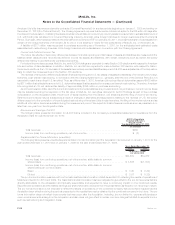
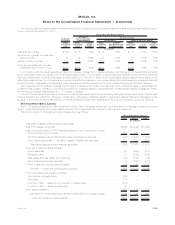
Concentrations of Credit Risk (Fixed Maturity Securities) — RMBS. The table below presents the Company’s RMBS holdings and
portion rated Aaa/AAA and portion rated NAIC 1 at:
Estimated
Fair
Value %of
Total
Estimated
Fair
Value %of
Total
2010 2009
December 31,
(In millions)
By security type:
Pass-throughsecurities ............................................. $22,430 50.1% $19,540 44.4%
Collateralizedmortgageobligations...................................... 22,303 49.9 24,480 55.6
Total RMBS . . . . . . . . . . . . . . . . . . . . . . . . . . . . . . . . . . . . . . . . . . . . . . . . . . . . $44,733 100.0% $44,020 100.0%
By risk profile:
Agency........................................................ $34,254 76.6% $33,334 75.7%
Prime ......................................................... 6,258 14.0 6,775 15.4
Alternativeresidentialmortgageloans .................................... 4,221 9.4 3,911 8.9
Total RMBS . . . . . . . . . . . . . . . . . . . . . . . . . . . . . . . . . . . . . . . . . . . . . . . . . . . . $44,733 100.0% $44,020 100.0%
PortionratedAaa/AAA................................................ $36,085 80.7% $35,626 80.9%
PortionratedNAIC1................................................. $38,984 87.1% $38,464 87.4%
Pass-through mortgage-backed securities are a type of asset-backed security that is secured by a mortgage or collection of mortgages.
The monthly mortgage payments from homeowners pass from the originating bank through an intermediary, such as a government agency or
investment bank, which collects the payments, and for a fee, remits or passes these payments through to the holders of the pass-through
securities. Collateralized mortgage obligations are a type of mortgage-backed security structured by dividing the cash flows of mortgages
into separate pools or tranches of risk that create multiple classes of bonds with varying maturities and priority of payments.
Prime residential mortgage lending includes the origination of residential mortgage loans to the most creditworthy borrowers with high
quality credit profiles. Alternative residential mortgage loans (“Alt-A”) are a classification of mortgage loans where the risk profile of the
borrower falls between prime and sub-prime. Sub-prime mortgage lending is the origination of residential mortgage loans to borrowers with
weak credit profiles. Included within Alt-A RMBS are resecuritization of real estate mortgage investment conduit (“Re-REMIC”) securities. Re-
REMIC Alt-A RMBS involve the pooling of previous issues of Alt-A RMBS and restructuring the combined pools to create new senior and
subordinated securities. The credit enhancement on the senior tranches is improved through the resecuritization. The Company’s holdings
are in senior tranches with significant credit enhancement.
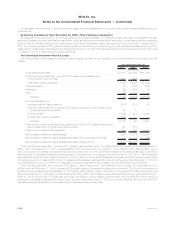
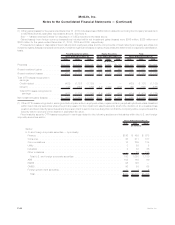
The following tables present the Company’s investment in Alt-A RMBS by vintage year (vintage year refers to the year of origination and not
to the year of purchase) and certain other selected data:
Estimated
Fair
Value %of
Total
Estimated
Fair
Value %of
Total
2010 2009
December 31,
(In millions)
Vintage Year:
2004 & Prior . . . . . . . . . . . . . . . . . . . . . . . . . . . . . . . . . . . . . . . . . . . . $ 93 2.2% $ 109 2.8%
2005 . . . . . . . . . . . . . . . . . . . . . . . . . . . . . . . . . . . . . . . . . . . . . . . . . 1,483 35.1 1,395 35.7
2006 . . . . . . . . . . . . . . . . . . . . . . . . . . . . . . . . . . . . . . . . . . . . . . . . . 1,013 24.0 811 20.7
2007 . . . . . . . . . . . . . . . . . . . . . . . . . . . . . . . . . . . . . . . . . . . . . . . . . 922 21.8 814 20.8
2008 . . . . . . . . . . . . . . . . . . . . . . . . . . . . . . . . . . . . . . . . . . . . . . . . . 7 0.2 — —
2009(1) . . . . . . . . . . . . . . . . . . . . . . . . . . . . . . . . . . . . . . . . . . . . . . . 671 15.9 782 20.0
2010(1) . . . . . . . . . . . . . . . . . . . . . . . . . . . . . . . . . . . . . . . . . . . . . . . 32 0.8 — —
Total . . . . . . . . . . . . . . . . . . . . . . . . . . . . . . . . . . . . . . . . . . . . . . . . . $4,221 100.0% $3,911 100.0%
F-37MetLife, Inc.
MetLife, Inc.
Notes to the Consolidated Financial Statements — (Continued)