MetLife 2010 Annual Report Download - page 158
Download and view the complete annual report
Please find page 158 of the 2010 MetLife annual report below. You can navigate through the pages in the report by either clicking on the pages listed below, or by using the keyword search tool below to find specific information within the annual report.-
 1
1 -
2
-
3
-
4
-
5
-
6
-
7
-
8
-
9
-
10
-
11
-
12
-
13
-
14
-
15
-
16
-
17
-
18
-
19
-
20
-
21
-
22
-
23
-
24
-
25
-
26
-
27
-
28
-
29
-
30
-
31
-
32
-
33
-
34
-
35
-
36
-
37
-
38
-
39
-
40
-
41
-
42
-
43
-
44
-
45
-
46
-
47
-
48
-
49
-
50
-
51
-
52
-
53
-
54
-
55
-
56
-
57
-
58
-
59
-
60
-
61
-
62
-
63
-
64
-
65
-
66
-
67
-
68
-
69
-
70
-
71
-
72
-
73
-
74
-
75
-
76
-
77
-
78
-
79
-
80
-
81
-
82
-
83
-
84
-
85
-
86
-
87
-
88
-
89
-
90
-
91
-
92
-
93
-
94
-
95
-
96
-
97
-
98
-
99
-
100
-
101
-
102
-
103
-
104
-
105
-
106
-
107
-
108
-
109
-
110
-
111
-
112
-
113
-
114
-
115
-
116
-
117
-
118
-
119
-
120
-
121
-
122
-
123
-
124
-
125
-
126
-
127
-
128
-
129
-
130
-
131
-
132
-
133
-
134
-
135
-
136
-
137
-
138
-
139
-
140
-
141
-
142
-
143
-
144
-
145
-
146
-
147
-
 148
148 -
 149
149 -
 150
150 -
 151
151 -
 152
152 -
 153
153 -
 154
154 -
 155
155 -
 156
156 -
 157
157 -
 158
158 -
 159
159 -
 160
160 -
 161
161 -
 162
162 -
 163
163 -
 164
164 -
 165
165 -
 166
166 -
 167
167 -
 168
168 -
169
-
170
-
171
-
172
-
173
-
174
-
175
-
176
-
177
-
178
-
179
-
180
-
181
-
182
-
183
-
184
-
185
-
186
-
187
-
188
-
189
-
190
-
191
-
192
-
193
-
194
-
195
-
196
-
197
-
198
-
199
-
200
-
201
-
202
-
203
-
204
-
205
-
206
-
207
-
208
-
209
-
210
-
211
-
212
-
213
-
214
-
215
-
216
-
217
-
218
-
219
-
220
-
221
-
222
-
223
-
224
-
225
-
226
-
227
-
228
-
229
-
230
-
231
-
232
-
233
-
234
-
235
-
236
-
237
-
238
-
239
-
240
-
241
-
242
 |
 |

(3) Included in premiums, reinsurance and other receivables in the consolidated balance sheets.
Without considering the effect of netting agreements, the estimated fair value of the Company’s over-the-counter derivatives with credit-
contingent provisions that were in a gross liability position at December 31, 2010 was $1,742 million. At December 31, 2010, the Company
provided securities collateral of $1,024 million in connection with these derivatives. In the unlikely event that both: (i) the Company’s credit
rating was downgraded to a level that triggers full overnight collateralization or termination of all derivative positions; and (ii) the Company’s
netting agreements were deemed to be legally unenforceable, then the additional collateral that the Company would be required to provide to
its counterparties in connection with its derivatives in a gross liability position at December 31, 2010 would be $718 million. This amount does
not consider gross derivative assets of $575 million for which the Company has the contractual right of offset.
The Company also has exchange-traded futures and options, which require the pledging of collateral. At December 31, 2010 and 2009,
the Company pledged securities collateral for exchange-traded futures and options of $40 million and $50 million, respectively, which is
included in fixed maturity securities. The counterparties are permitted by contract to sell or repledge this collateral. At December 31, 2010
and 2009, the Company provided cash collateral for exchange-traded futures and options of $662 million and $562 million, respectively,
which is included in premiums, reinsurance and other receivables.
Embedded Derivatives
The Company has certain embedded derivatives that are required to be separated from their host contracts and accounted for as
derivatives. These host contracts principally include: variable annuities with guaranteed minimum benefits, including GMWBs, GMABs and
certain GMIBs; ceded reinsurance contracts of guaranteed minimum benefits related to GMABs and certain GMIBs; and funding agreements
with equity or bond indexed crediting rates.
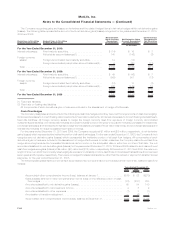
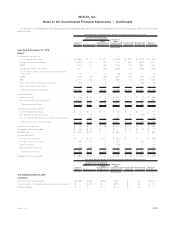
The following table presents the estimated fair value of the Company’s embedded derivatives at:
2010 2009
December 31,
(In millions)
Net embedded derivatives within asset host contracts:
Cededguaranteedminimumbenefits......................................... $ 185 $ 76
Optionsembeddedindebtorequitysecurities .................................. (57) (37)
Netembeddedderivativeswithinassethostcontracts ............................ $ 128 $ 39
Net embedded derivatives within liability host contracts:
Directguaranteedminimumbenefits......................................... $2,556 $1,500
Other............................................................. 78 5
Netembeddedderivativeswithinliabilityhostcontracts ........................... $2,634 $1,505
The following table presents changes in estimated fair value related to embedded derivatives:
2010 2009 2008
Years Ended December 31,
(In millions)
Netderivativegains(losses)(1)........................................ $(387) $1,758 $(2,650)
Policyholderbenefitsandclaims....................................... $ 8 $ (114) $ 182
(1) The valuation of guaranteed minimum benefits includes an adjustment for nonperformance risk. Included in net derivative gains (losses),
in connection with this adjustment, were gains (losses) of ($96) million, ($1,932) million and $2,994 million for the years ended
December 31, 2010, 2009 and 2008, respectively. Net derivative gains (losses) for the year ended December 31, 2010 included a
loss of $955 million relating to a refinement for estimating nonperformance risk in fair value measurements implemented at June 30, 2010.
SeeNote5.
F-69MetLife, Inc.
MetLife, Inc.
Notes to the Consolidated Financial Statements — (Continued)