MetLife 2010 Annual Report Download - page 7
Download and view the complete annual report
Please find page 7 of the 2010 MetLife annual report below. You can navigate through the pages in the report by either clicking on the pages listed below, or by using the keyword search tool below to find specific information within the annual report.-
 1
1 -
 2
2 -
 3
3 -
 4
4 -
 5
5 -
 6
6 -
 7
7 -
 8
8 -
 9
9 -
 10
10 -
 11
11 -
 12
12 -
 13
13 -
 14
14 -
 15
15 -
 16
16 -
 17
17 -
 18
18 -
19
-
20
-
21
-
22
-
23
-
24
-
25
-
26
-
27
-
28
-
29
-
30
-
31
-
32
-
33
-
34
-
35
-
36
-
37
-
38
-
39
-
40
-
41
-
42
-
43
-
44
-
45
-
46
-
47
-
48
-
49
-
50
-
51
-
52
-
53
-
54
-
55
-
56
-
57
-
58
-
59
-
60
-
61
-
62
-
63
-
64
-
65
-
66
-
67
-
68
-
69
-
70
-
71
-
72
-
73
-
74
-
75
-
76
-
77
-
78
-
79
-
80
-
81
-
82
-
83
-
84
-
85
-
86
-
87
-
88
-
89
-
90
-
91
-
92
-
93
-
94
-
95
-
96
-
97
-
98
-
99
-
100
-
101
-
102
-
103
-
104
-
105
-
106
-
107
-
108
-
109
-
110
-
111
-
112
-
113
-
114
-
115
-
116
-
117
-
118
-
119
-
120
-
121
-
122
-
123
-
124
-
125
-
126
-
127
-
128
-
129
-
130
-
131
-
132
-
133
-
134
-
135
-
136
-
137
-
138
-
139
-
140
-
141
-
142
-
143
-
144
-
145
-
146
-
147
-
148
-
149
-
150
-
151
-
152
-
153
-
154
-
155
-
156
-
157
-
158
-
159
-
160
-
161
-
162
-
163
-
164
-
165
-
166
-
167
-
168
-
169
-
170
-
171
-
172
-
173
-
174
-
175
-
176
-
177
-
178
-
179
-
180
-
181
-
182
-
183
-
184
-
185
-
186
-
187
-
188
-
189
-
190
-
191
-
192
-
193
-
194
-
195
-
196
-
197
-
198
-
199
-
200
-
201
-
202
-
203
-
204
-
205
-
206
-
207
-
208
-
209
-
210
-
211
-
212
-
213
-
214
-
215
-
216
-
217
-
218
-
219
-
220
-
221
-
222
-
223
-
224
-
225
-
226
-
227
-
228
-
229
-
230
-
231
-
232
-
233
-
234
-
235
-
236
-
237
-
238
-
239
-
240
-
241
-
242
 |
 |

2010 2009 2008 2007 2006
December 31,
(In millions)
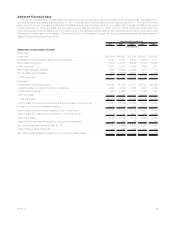
Balance Sheet Data(1)
Assets:
Generalaccountassets(2)................................ $547,569 $390,273 $380,839 $399,007 $383,758
Separate account assets . . . . . . . . . . . . . . . . . . . . . . . . . . . . . . . . . 183,337 149,041 120,839 160,142 144,349
Totalassets........................................ $730,906 $539,314 $501,678 $559,149 $528,107
Liabilities:
Policyholder liabilities and other policy-related balances(3) . . . . . . . . . . . $401,905 $283,759 $282,261 $261,442 $252,099
Payables for collateral under securities loaned and other transactions . . . . 27,272 24,196 31,059 44,136 45,846
Bankdeposits........................................ 10,316 10,211 6,884 4,534 4,638
Short-termdebt....................................... 306 912 2,659 667 1,449
Long-termdebt(2) ..................................... 27,586 13,220 9,667 9,100 8,822
Collateralfinancingarrangements ........................... 5,297 5,297 5,192 4,882 —
Junior subordinated debt securities . . . . . . . . . . . . . . . . . . . . . . . . . . 3,191 3,191 3,758 4,075 3,381
Other(2)............................................ 22,583 15,989 15,374 33,186 32,277
Separate account liabilities . . . . . . . . . . . . . . . . . . . . . . . . . . . . . . . . 183,337 149,041 120,839 160,142 144,349
Total liabilities . . . . . . . . . . . . . . . . . . . . . . . . . . . . . . . . . . . . . . . 681,793 505,816 477,693 522,164 492,861
Redeemable noncontrolling interests in partially owned consolidated
securities.......................................... 117 — — — —
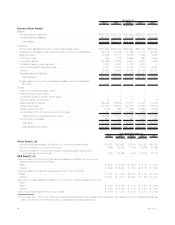
Equity:
MetLife, Inc.’s stockholders’ equity:
Preferredstock,atparvalue............................... 1 1 1 1 1
Convertiblepreferredstock,atparvalue....................... — — — — —
Commonstock,atparvalue............................... 10 8 8 8 8
Additional paid-in capital . . . . . . . . . . . . . . . . . . . . . . . . . . . . . . . . . 26,423 16,859 15,811 17,098 17,454
Retainedearnings ..................................... 21,363 19,501 22,403 19,884 16,574
Treasurystock,atcost .................................. (172) (190) (236) (2,890) (1,357)
Accumulated other comprehensive income (loss) . . . . . . . . . . . . . . . . . 1,000 (3,058) (14,253) 1,078 1,118
Total MetLife, Inc.’s stockholders’ equity . . . . . . . . . . . . . . . . . . . . . . 48,625 33,121 23,734 35,179 33,798
Noncontrollinginterests.................................. 371 377 251 1,806 1,448
Totalequity ........................................ 48,996 33,498 23,985 36,985 35,246
Total liabilities and equity . . . . . . . . . . . . . . . . . . . . . . . . . . . . . . . . $730,906 $539,314 $501,678 $559,149 $528,107
2010 2009 2008 2007 2006
Years Ended December 31,
(In millions, except per share data)
Other Data(1), (4)
Net income (loss) available to MetLife, Inc.’s common shareholders . . . . . . . . . $2,668 $(2,368) $ 3,084 $ 4,180 $ 6,159
ReturnonMetLife,Inc.’scommonequity........................... 6.9% (9.0)% 11.2% 12.9% 20.9%
Return on MetLife, Inc.’s common equity, excluding accumulated other
comprehensiveincome(loss)................................. 7.0% (6.8)% 9.1% 13.3% 22.1%
EPS Data(1), (5)
Income (Loss) from Continuing Operations Available to MetLife, Inc.’s Common
Shareholders Per Common Share:
Basic.................................................. $ 3.01 $ (2.94) $ 4.60 $ 5.32 $ 3.64
Diluted................................................. $ 2.99 $ (2.94) $ 4.54 $ 5.19 $ 3.59
Income (Loss) from Discontinued Operations Per Common Share:
Basic.................................................. $ 0.01 $ 0.05 $(0.41) $ 0.30 $ 4.45
Diluted................................................. $ 0.01 $ 0.05 $(0.40) $ 0.29 $ 4.40
Net Income (Loss) Available to MetLife, Inc.’s Common Shareholders Per Common
Share:
Basic.................................................. $ 3.02 $ (2.89) $ 4.19 $ 5.62 $ 8.09
Diluted................................................. $ 3.00 $ (2.89) $ 4.14 $ 5.48 $ 7.99
CashDividendsDeclaredPerCommonShare......................... $ 0.74 $ 0.74 $ 0.74 $ 0.74 $ 0.59
(1) On November 1, 2010, the Holding Company acquired ALICO. The results of the Acquisition are reflected in the 2010 selected financial
data. See Note 2 of the Notes to the Consolidated Financial Statements.
4MetLife, Inc.