MetLife 2010 Annual Report Download - page 16
Download and view the complete annual report
Please find page 16 of the 2010 MetLife annual report below. You can navigate through the pages in the report by either clicking on the pages listed below, or by using the keyword search tool below to find specific information within the annual report.-
 1
1 -
2
-
3
-
4
-
5
-
 6
6 -
 7
7 -
 8
8 -
 9
9 -
 10
10 -
 11
11 -
 12
12 -
 13
13 -
 14
14 -
 15
15 -
 16
16 -
 17
17 -
 18
18 -
 19
19 -
 20
20 -
 21
21 -
 22
22 -
 23
23 -
 24
24 -
 25
25 -
 26
26 -
27
-
28
-
29
-
30
-
31
-
32
-
33
-
34
-
35
-
36
-
37
-
38
-
39
-
40
-
41
-
42
-
43
-
44
-
45
-
46
-
47
-
48
-
49
-
50
-
51
-
52
-
53
-
54
-
55
-
56
-
57
-
58
-
59
-
60
-
61
-
62
-
63
-
64
-
65
-
66
-
67
-
68
-
69
-
70
-
71
-
72
-
73
-
74
-
75
-
76
-
77
-
78
-
79
-
80
-
81
-
82
-
83
-
84
-
85
-
86
-
87
-
88
-
89
-
90
-
91
-
92
-
93
-
94
-
95
-
96
-
97
-
98
-
99
-
100
-
101
-
102
-
103
-
104
-
105
-
106
-
107
-
108
-
109
-
110
-
111
-
112
-
113
-
114
-
115
-
116
-
117
-
118
-
119
-
120
-
121
-
122
-
123
-
124
-
125
-
126
-
127
-
128
-
129
-
130
-
131
-
132
-
133
-
134
-
135
-
136
-
137
-
138
-
139
-
140
-
141
-
142
-
143
-
144
-
145
-
146
-
147
-
148
-
149
-
150
-
151
-
152
-
153
-
154
-
155
-
156
-
157
-
158
-
159
-
160
-
161
-
162
-
163
-
164
-
165
-
166
-
167
-
168
-
169
-
170
-
171
-
172
-
173
-
174
-
175
-
176
-
177
-
178
-
179
-
180
-
181
-
182
-
183
-
184
-
185
-
186
-
187
-
188
-
189
-
190
-
191
-
192
-
193
-
194
-
195
-
196
-
197
-
198
-
199
-
200
-
201
-
202
-
203
-
204
-
205
-
206
-
207
-
208
-
209
-
210
-
211
-
212
-
213
-
214
-
215
-
216
-
217
-
218
-
219
-
220
-
221
-
222
-
223
-
224
-
225
-
226
-
227
-
228
-
229
-
230
-
231
-
232
-
233
-
234
-
235
-
236
-
237
-
238
-
239
-
240
-
241
-
242
 |
 |

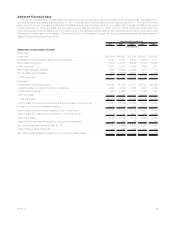
carrying values of PABs would be reported in net investment gains (losses) and changes in the carrying value of DAC and VOBA would be
reported in other expenses. However, these estimated effects do not take into account potential changes in other variables, such as equity
price levels and market volatility, that can also contribute significantly to changes in carrying values. Therefore, the table does not necessarily
reflect the ultimate impact on the consolidated financial statements under the credit spread variance scenarios presented below.
In determining the ranges, the Company has considered current market conditions as well as the market level of spreads that can
reasonably be anticipated over the near term. The ranges do not reflect extreme market conditions experienced during the 2008 and 2009
economic crisis as the Company does not consider those to be reasonably likely events in the near future.
PABs DAC and
VOBA
Carrying Value
At December 31, 2010
(In millions)
100% increase in the Company’s credit spread . . . . . . . . . . . . . . . . . . . . . . . . . . . . . . . . . . . $1,551 $ 79
Asreported.......................................................... $2,357 $110
50%decreaseintheCompany’screditspread................................... $2,852 $130
The estimated fair value of the embedded equity and bond indexed derivatives contained in certain funding agreements is determined
using market standard swap valuation models and observable market inputs, including an adjustment for the Company’s nonperformance risk
that takes into consideration publicly available information relating to the Company’s debt, as well as its claims paying ability. Changes in
equity and bond indices, interest rates and the Company’s credit standing may result in significant fluctuations in estimated the fair value of
these embedded derivatives that could materially affect net income.
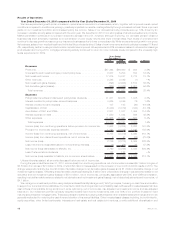
Deferred Policy Acquisition Costs and Value of Business Acquired
The Company incurs significant costs in connection with acquiring new and renewal insurance business. Costs that vary with and relate to
the production of new business are deferred as DAC. Such costs consist principally of commissions and agency and policy issuance
expenses. VOBA is an intangible asset that represents the excess of book value over the estimated fair value of acquired insurance, annuity,
and investment-type contracts in-force at the acquisition date. The estimated fair value of the acquired liabilities is based on actuarially
determined projections, by each block of business, of future policy and contract charges, premiums, mortality and morbidity, separate
account performance, surrenders, operating expenses, investment returns, nonperformance risk adjustment and other factors. Actual
experience on the purchased business may vary from these projections. The recovery of DAC and VOBA is dependent upon the future
profitability of the related business. DAC and VOBA are aggregated in the consolidated financial statements for reporting purposes.
Note 1 of the Notes to the Consolidated Financial Statements describes the Company’s accounting policy relating to DAC and VOBA
amortization for various types of contracts.
Separate account rates of return on variable universal life contracts and variable deferred annuity contracts affect in-force account
balances on such contracts each reporting period which can result in significant fluctuations in amortization of DAC and VOBA. The
Company’s practice to determine the impact of gross profits resulting from returns on separate accounts assumes that long-term appre-
ciation in equity markets is not changed by short-term market fluctuations, but is only changed when sustained interim deviations are
expected. The Company monitors these events and only changes the assumption when its long-term expectation changes. The effect of an
increase/(decrease) by 100 basis points in the assumed future rate of return is reasonably likely to result in a decrease/(increase) in the DAC
and VOBA amortization of approximately $128 million with an offset to the Company’s unearned revenue liability of approximately $19 million
for this factor.
The Company also periodically reviews other long-term assumptions underlying the projections of estimated gross margins and profits.
These include investment returns, policyholder dividend scales, interest crediting rates, mortality, persistency, and expenses to administer
business. We annually update assumptions used in the calculation of estimated gross margins and profits which may have significantly
changed. If the update of assumptions causes expected future gross margins and profits to increase, DAC and VOBA amortization will
decrease, resulting in a current period increase to earnings. The opposite result occurs when the assumption update causes expected future
gross margins and profits to decrease.
The Company’s most significant assumption updates resulting in a change to expected future gross margins and profits and the
amortization of DAC and VOBA were due to revisions to expected future investment returns, expenses, in-force or persistency assumptions
and policyholder dividends on contracts included within the Insurance Products and Retirement Products segments. The Company expects
these assumptions to be the ones most reasonably likely to cause significant changes in the future. Changes in these assumptions can be
offsetting and the Company is unable to predict their movement or offsetting impact over time.
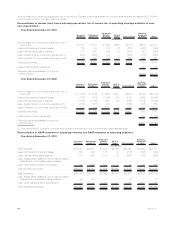
Note 6 of the Notes to the Consolidated Financial Statements provides a rollforward of DAC and VOBA for the Company for each of the
years ended December 31, 2010, 2009 and 2008, as well as a breakdown of DAC and VOBA by segment and reporting unit at December 31,
2010 and 2009.
At December 31, 2010, 2009 and 2008, DAC and VOBA for the Company was $27.3 billion, $19.3 billion and $20.1 million, respectively.
The DAC and VOBA balance increased significantly as a result of the Acquisition, which contributed $8.9 billion to the balance at
December 31, 2010. Approximately 55%, of the Company’s DAC and VOBA was associated with the Insurance Products and Retirement
Products segments at December 31, 2010. At December 31, 2010, 2009 and 2008, DAC and VOBA for these segments was $14.9 billion,
$16.1 billion and $17.4 billion, respectively. Amortization of DAC and VOBA associated with the variable and universal life and the annuities
contracts within the Insurance Products and Retirement Products segments is significantly impacted by movements in equity markets. The
following chart illustrates the effect on DAC and VOBA within the Company’s U.S. Business of changing each of the respective assumptions,
as well as updating estimated gross margins or profits with actual gross margins or profits during the years ended December 31, 2010, 2009
and 2008. Increases (decreases) in DAC and VOBA balances, as presented below, resulted in a corresponding decrease (increase) in
amortization.
13MetLife, Inc.