MetLife 2010 Annual Report Download - page 33
Download and view the complete annual report
Please find page 33 of the 2010 MetLife annual report below. You can navigate through the pages in the report by either clicking on the pages listed below, or by using the keyword search tool below to find specific information within the annual report.-
 1
1 -
2
-
3
-
4
-
5
-
6
-
7
-
8
-
9
-
10
-
11
-
12
-
13
-
14
-
15
-
16
-
17
-
18
-
19
-
20
-
21
-
22
-
 23
23 -
 24
24 -
 25
25 -
 26
26 -
 27
27 -
 28
28 -
 29
29 -
 30
30 -
 31
31 -
 32
32 -
 33
33 -
 34
34 -
 35
35 -
 36
36 -
 37
37 -
 38
38 -
 39
39 -
 40
40 -
 41
41 -
 42
42 -
 43
43 -
44
-
45
-
46
-
47
-
48
-
49
-
50
-
51
-
52
-
53
-
54
-
55
-
56
-
57
-
58
-
59
-
60
-
61
-
62
-
63
-
64
-
65
-
66
-
67
-
68
-
69
-
70
-
71
-
72
-
73
-
74
-
75
-
76
-
77
-
78
-
79
-
80
-
81
-
82
-
83
-
84
-
85
-
86
-
87
-
88
-
89
-
90
-
91
-
92
-
93
-
94
-
95
-
96
-
97
-
98
-
99
-
100
-
101
-
102
-
103
-
104
-
105
-
106
-
107
-
108
-
109
-
110
-
111
-
112
-
113
-
114
-
115
-
116
-
117
-
118
-
119
-
120
-
121
-
122
-
123
-
124
-
125
-
126
-
127
-
128
-
129
-
130
-
131
-
132
-
133
-
134
-
135
-
136
-
137
-
138
-
139
-
140
-
141
-
142
-
143
-
144
-
145
-
146
-
147
-
148
-
149
-
150
-
151
-
152
-
153
-
154
-
155
-
156
-
157
-
158
-
159
-
160
-
161
-
162
-
163
-
164
-
165
-
166
-
167
-
168
-
169
-
170
-
171
-
172
-
173
-
174
-
175
-
176
-
177
-
178
-
179
-
180
-
181
-
182
-
183
-
184
-
185
-
186
-
187
-
188
-
189
-
190
-
191
-
192
-
193
-
194
-
195
-
196
-
197
-
198
-
199
-
200
-
201
-
202
-
203
-
204
-
205
-
206
-
207
-
208
-
209
-
210
-
211
-
212
-
213
-
214
-
215
-
216
-
217
-
218
-
219
-
220
-
221
-
222
-
223
-
224
-
225
-
226
-
227
-
228
-
229
-
230
-
231
-
232
-
233
-
234
-
235
-
236
-
237
-
238
-
239
-
240
-
241
-
242
 |
 |

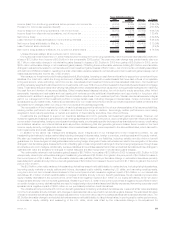
nonperformance risk. Both long-term and mid-term interest rates increased in the current period which had a positive impact of $2.2 billion.
Improving equity markets in the current period had a positive impact of $1.5 billion. Lower equity market volatility in the current period
compared to the prior period had a positive impact of $817 million, and the weakening U.S. dollar had a positive impact of $456 million. The
favorable results from these hedged risks was partially offset by an unfavorable change related to the adjustment for nonperformance risk of
$3.2 billion, from gains of $1.9 billion in 2008 to losses of $1.3 billion in 2009. Gains on the freestanding derivatives that hedged these
embedded derivative risks more than offset the change in liabilities attributable to market factors, excluding the adjustment for nonperfor-
mance risk. Finally, there was a favorable change of $1.1 billion for all other unhedged risks on the variable annuity minimum benefit guarantee
liabilities.
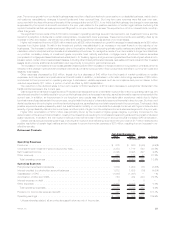
The $525 million unfavorable change in net investment gains (losses) was primarily attributable to higher net losses on mortgage loans and
otherlimitedpartnershipinterests.Theincreaseinlossesonmortgageloanswasprincipallyduetoincreasesinmortgagevaluation
allowances resulting from weakening of the real estate market and other economic fundamentals. The increase in losses on other limited
partnership interests was principally due to higher impairments on certain cost method investments which experienced a reduction in net
asset values of the underlying portfolio companies. The underlying valuations of the portfolio companies have decreased due to the current
economic environment.
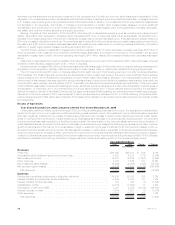
As more fully described in the discussion of performance measures above, operating earnings is the measure of segment profit or loss we
use to evaluate performance and allocate resources. Consistent with GAAP accounting guidance for segment reporting, it is our measure of
performance, as reported below. Operating earnings is not determined in accordance with GAAP and should not be viewed as a substitute for
GAAP income (loss) from continuing operations, net of income tax. We believe that the presentation of operating earnings enhances the
understanding of our performance by highlighting the results of operations and the underlying profitability drivers of the business. Operating
earnings available to common shareholders decreased by $329 million to $2.4 billion in 2009 from $2.7 billion in 2008.
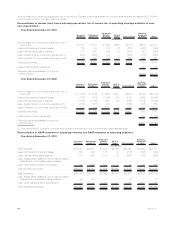
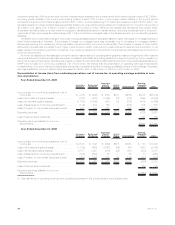
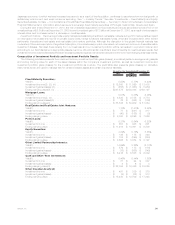
Reconciliation of income (loss) from continuing operations, net of income tax, to operating earnings available to com-
mon shareholders
Year Ended December 31, 2009
Insurance
Products Retirement
Products
Corporate
Benefit
Funding Auto &
Home International
Banking,
Corporate
&Other Total
(In millions)
Income (loss) from continuing operations, net of
income tax . . . . . . . . . . . . . . . . . . . . . . . . . . . $ (418) $ (628) $ (581) $321 $(280) $(733) $(2,319)
Less: Net investment gains (losses) . . . . . . . . . . . . . (472) (533) (1,486) (41) (105) (269) (2,906)
Less: Net derivative gains (losses) . . . . . . . . . . . . . (1,786) (1,426) (421) 39 (798) (474) (4,866)
Less: Adjustments to continuing operations(1) . . . . . . (139) 519 125 — (206) (16) 283
Less: Provision for income tax (expense) benefit . . . . 837 504 621 1 366 354 2,683
Operatingearnings ....................... $1,142 $ 308 $ 580 $322 $463 (328) 2,487
Less:Preferredstockdividends ............... 122 122
Operating earnings available to common
shareholders.......................... $(450) $2,365
Year Ended December 31, 2008
Insurance
Products Retirement
Products
Corporate
Benefit
Funding Auto &
Home International
Banking,
Corporate
&Other Total
(In millions)
Income (loss) from continuing operations, net of
incometax ........................... $2,195 $ 539 $ (256) $275 $553 $ 173 $3,479
Less: Net investment gains (losses) . . . . . . . . . . . . . (1,219) (669) (1,682) (89) (91) 1,652 (2,098)
Less: Net derivative gains (losses) . . . . . . . . . . . . . 2,777 1,842 (219) (45) 260 (705) 3,910
Less: Adjustments to continuing operations(1) . . . . . . (193) (622) 82 — 52 17 (664)
Less: Provision for income tax (expense) benefit . . . . (480) (192) 637 46 (147) (352) (488)
Operatingearnings ....................... $1,310 $ 180 $ 926 $363 $479 (439) 2,819
Less:Preferredstockdividends ............... 125 125
Operating earnings available to common
shareholders.......................... $ (564) $2,694
(1) See definitions of operating revenues and operating expenses for the components of such adjustments.
30 MetLife, Inc.