MetLife 2010 Annual Report Download - page 134
Download and view the complete annual report
Please find page 134 of the 2010 MetLife annual report below. You can navigate through the pages in the report by either clicking on the pages listed below, or by using the keyword search tool below to find specific information within the annual report.-
 1
1 -
2
-
3
-
4
-
5
-
6
-
7
-
8
-
9
-
10
-
11
-
12
-
13
-
14
-
15
-
16
-
17
-
18
-
19
-
20
-
21
-
22
-
23
-
24
-
25
-
26
-
27
-
28
-
29
-
30
-
31
-
32
-
33
-
34
-
35
-
36
-
37
-
38
-
39
-
40
-
41
-
42
-
43
-
44
-
45
-
46
-
47
-
48
-
49
-
50
-
51
-
52
-
53
-
54
-
55
-
56
-
57
-
58
-
59
-
60
-
61
-
62
-
63
-
64
-
65
-
66
-
67
-
68
-
69
-
70
-
71
-
72
-
73
-
74
-
75
-
76
-
77
-
78
-
79
-
80
-
81
-
82
-
83
-
84
-
85
-
86
-
87
-
88
-
89
-
90
-
91
-
92
-
93
-
94
-
95
-
96
-
97
-
98
-
99
-
100
-
101
-
102
-
103
-
104
-
105
-
106
-
107
-
108
-
109
-
110
-
111
-
112
-
113
-
114
-
115
-
116
-
117
-
118
-
119
-
120
-
121
-
122
-
123
-
 124
124 -
 125
125 -
 126
126 -
 127
127 -
 128
128 -
 129
129 -
 130
130 -
 131
131 -
 132
132 -
 133
133 -
 134
134 -
 135
135 -
 136
136 -
 137
137 -
 138
138 -
 139
139 -
 140
140 -
 141
141 -
 142
142 -
 143
143 -
 144
144 -
145
-
146
-
147
-
148
-
149
-
150
-
151
-
152
-
153
-
154
-
155
-
156
-
157
-
158
-
159
-
160
-
161
-
162
-
163
-
164
-
165
-
166
-
167
-
168
-
169
-
170
-
171
-
172
-
173
-
174
-
175
-
176
-
177
-
178
-
179
-
180
-
181
-
182
-
183
-
184
-
185
-
186
-
187
-
188
-
189
-
190
-
191
-
192
-
193
-
194
-
195
-
196
-
197
-
198
-
199
-
200
-
201
-
202
-
203
-
204
-
205
-
206
-
207
-
208
-
209
-
210
-
211
-
212
-
213
-
214
-
215
-
216
-
217
-
218
-
219
-
220
-
221
-
222
-
223
-
224
-
225
-
226
-
227
-
228
-
229
-
230
-
231
-
232
-
233
-
234
-
235
-
236
-
237
-
238
-
239
-
240
-
241
-
242
 |
 |

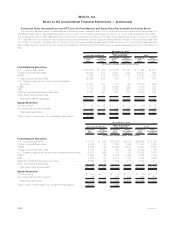
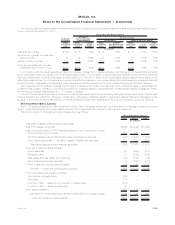
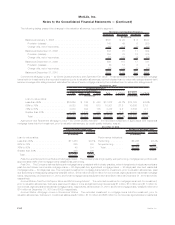
The following table presents certain information about the Company’s equity securities available-for-sale with a gross unrealized loss of
20% or more at December 31, 2010:
Gross
Unrealized
Loss
Gross
Unrealized
Loss
%ofAll
Equity
Securities
Gross
Unrealized
Loss
%ofAll
Non-Redeemable
Preferred Stock
Gross
Unrealized
Loss %ofAll
Industries
%A
Rated or
Better
All Equity
Securities
All Types of
Non-Redeemable
Preferred Stock All Industries Financial Services Industry
Investment Grade
Non-Redeemable Preferred Stock
(In millions)
Less than six months . . . . . . . . . . . . . $ 22 $ 18 82% $ 9 50% $ 9 100% 100%
Six months or greater but less than
twelvemonths................ 32 32 100% 32 100% 32 100% 50%
Twelve months or greater . . . . . . . . . . 116 116 100% 115 99% 115 100% 77%
All equity securities with a gross
unrealized loss of 20% or more . . . . . $170 $166 98% $156 94% $156 100% 73%
In connection with the equity securities impairment review process, the Company evaluated its holdings in non-redeemable preferred
stock, particularly those companies in the financial services industry. The Company considered several factors including whether there has
been any deterioration in credit of the issuer and the likelihood of recovery in value of non-redeemable preferred stock with a severe or an
extended unrealized loss. The Company also considered whether any issuers of non-redeemable preferred stock with an unrealized loss held
by the Company, regardless of credit rating, have deferred any dividend payments. No such dividend payments had been deferred.
With respect to common stock holdings, the Company considered the duration and severity of the unrealized losses for securities in an
unrealized loss position of 20% or more; and the duration of unrealized losses for securities in an unrealized loss position of less than 20% in
an extended unrealized loss position (i.e., 12 months or greater).
Future OTTIs will depend primarily on economic fundamentals, issuer performance (including changes in the present value of future cash
flows expected to be collected), changes in credit rating, changes in collateral valuation, changes in interest rates and changes in credit
spreads. If economic fundamentals and any of the above factors deteriorate, additional OTTIs may be incurred in upcoming quarters.
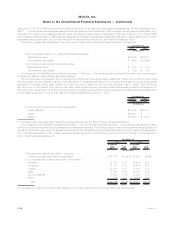
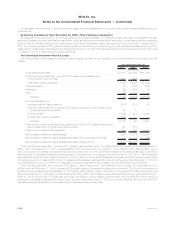
Net Investment Gains (Losses)
See “— Evaluating Available-for-Sale Securities for Other-Than-Temporary Impairment” for a discussion of changes in guidance adopted
April 1, 2009 that impacted how fixed maturity security OTTI losses that are charged to earnings are measured.
The components of net investment gains (losses) were as follows:
2010 2009 2008
Years Ended December 31,
(In millions)
Total gains (losses) on fixed maturity securities:
Total OTTI losses recognized . . . . . . . . . . . . . . . . . . . . . . . . . . . . . . . . . . . . . . . . . $(682) $(2,439) $(1,296)
Less: Noncredit portion of OTTI losses transferred to and recognized in other
comprehensiveincome(loss)....................................... 212 939 —
Net OTTI losses on fixed maturity securities recognized in earnings . . . . . . . . . . . . . . (470) (1,500) (1,296)
Fixedmaturitysecurities—netgains(losses)onsalesanddisposals............. 215 (163) (657)
Totalgains(losses)onfixedmaturitysecurities .......................... (255) (1,663) (1,953)
Other net investment gains (losses):
Equitysecurities ............................................... 104 (399) (253)
Mortgageloans................................................ 22 (442) (136)
Realestateandrealestatejointventures ............................... (54) (164) (18)
Otherlimitedpartnershipinterests.................................... (18) (356) (140)
Otherinvestmentportfoliogains(losses)................................ (6) (26) 134
Subtotal—investmentportfoliogains(losses)........................... (207) (3,050) (2,366)
FVO consolidated securitization entities:
Commercialmortgageloans........................................ 758 — —
Securities.................................................... (78) — —
Long-termdebt—relatedtocommercialmortgageloans..................... (722) — —
Long-termdebt—relatedtosecurities................................. 48 — —
Othergains(losses)(1)............................................. (191) 144 268
Subtotal FVO consolidated securitization entities and other gains (losses) . . . . . . . . . (185) 144 268
Total net investment gains (losses) . . . . . . . . . . . . . . . . . . . . . . . . . . . . . . . . . $(392) $(2,906) $(2,098)
F-45MetLife, Inc.
MetLife, Inc.
Notes to the Consolidated Financial Statements — (Continued)