MetLife 2010 Annual Report Download - page 51
Download and view the complete annual report
Please find page 51 of the 2010 MetLife annual report below. You can navigate through the pages in the report by either clicking on the pages listed below, or by using the keyword search tool below to find specific information within the annual report.-
 1
1 -
2
-
3
-
4
-
5
-
6
-
7
-
8
-
9
-
10
-
11
-
12
-
13
-
14
-
15
-
16
-
17
-
18
-
19
-
20
-
21
-
22
-
23
-
24
-
25
-
26
-
27
-
28
-
29
-
30
-
31
-
32
-
33
-
34
-
35
-
36
-
37
-
38
-
39
-
40
-
 41
41 -
 42
42 -
 43
43 -
 44
44 -
 45
45 -
 46
46 -
 47
47 -
 48
48 -
 49
49 -
 50
50 -
 51
51 -
 52
52 -
 53
53 -
 54
54 -
 55
55 -
 56
56 -
 57
57 -
 58
58 -
 59
59 -
 60
60 -
 61
61 -
62
-
63
-
64
-
65
-
66
-
67
-
68
-
69
-
70
-
71
-
72
-
73
-
74
-
75
-
76
-
77
-
78
-
79
-
80
-
81
-
82
-
83
-
84
-
85
-
86
-
87
-
88
-
89
-
90
-
91
-
92
-
93
-
94
-
95
-
96
-
97
-
98
-
99
-
100
-
101
-
102
-
103
-
104
-
105
-
106
-
107
-
108
-
109
-
110
-
111
-
112
-
113
-
114
-
115
-
116
-
117
-
118
-
119
-
120
-
121
-
122
-
123
-
124
-
125
-
126
-
127
-
128
-
129
-
130
-
131
-
132
-
133
-
134
-
135
-
136
-
137
-
138
-
139
-
140
-
141
-
142
-
143
-
144
-
145
-
146
-
147
-
148
-
149
-
150
-
151
-
152
-
153
-
154
-
155
-
156
-
157
-
158
-
159
-
160
-
161
-
162
-
163
-
164
-
165
-
166
-
167
-
168
-
169
-
170
-
171
-
172
-
173
-
174
-
175
-
176
-
177
-
178
-
179
-
180
-
181
-
182
-
183
-
184
-
185
-
186
-
187
-
188
-
189
-
190
-
191
-
192
-
193
-
194
-
195
-
196
-
197
-
198
-
199
-
200
-
201
-
202
-
203
-
204
-
205
-
206
-
207
-
208
-
209
-
210
-
211
-
212
-
213
-
214
-
215
-
216
-
217
-
218
-
219
-
220
-
221
-
222
-
223
-
224
-
225
-
226
-
227
-
228
-
229
-
230
-
231
-
232
-
233
-
234
-
235
-
236
-
237
-
238
-
239
-
240
-
241
-
242
 |
 |
the Company expects to receive payments in accordance with the contractual terms of the securities that are considered temporarily
impaired.
CMBS. There have been disruptions in the CMBS market due to market perceptions that default rates will increase in part as a result of
weakness in commercial real estate market fundamentals and in part to relaxed underwriting standards by some originators of commercial
mortgage loans within the more recent vintage years (i.e., 2006 and later). These factors caused a pull-back in market liquidity, increased
credit spreads and repricing of risk, which has led to higher levels of unrealized losses as compared to historical levels through the first quarter
of 2010. However, in the second quarter of 2010, market conditions continued to improve and interest rates continue to decrease, causing
our portfolio to be in a net unrealized gain position of 2% of amortized cost at December 31, 2010.
CMBS in which the present value of projected future cash flows expected to be collected is less than amortized cost are reviewed for
impairment in accordance with our impairment policy. Based upon the analysis of the Company’s exposure to CMBS, the Company expects to
receive payments in accordance with the contractual terms of the securities that are considered temporarily impaired.
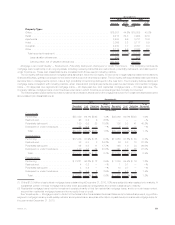
The Company’s holdings in CMBS were $20.7 billion and $15.6 billion, at estimated fair value at December 31, 2010 and 2009,
respectively. See “Investments — Fixed Maturity and Equity Securities Available-for-Sale — Concentrations of Credit Risk (Fixed Maturity
Securities) — CMBS” in Note 3 of the Notes to the Consolidated Financial Statements for tables that present the amortized cost and
estimated fair value, rating agency designation by Moody’s, S&P, Fitch or Realpoint, LLC and holdings by vintage year of such securities held
by the Company at December 31, 2010 and 2009. The Company had no exposure to CMBS index securities at December 31, 2010 or 2009.
The Company’s holdings of commercial real estate collateralized debt obligations securities were $138 million and $111 million at estimated
fair value at December 31, 2010 and 2009, respectively. The weighted average credit enhancement of the Company’s CMBS holdings was
26% and 28% at December 31, 2010 and 2009, respectively. This credit enhancement percentage represents the current weighted average
estimated percentage of outstanding capital structure subordinated to the Company’s investment holding that is available to absorb losses
before the security incurs the first dollar of loss of principal. The credit protection does not include any equity interest or property value in
excess of outstanding debt.
ABS. The Company’s ABS are diversified both by collateral type and by issuer. See “Investments — Fixed Maturity and Equity Securities
Available-for-Sale — Concentrations of Credit Risk (Fixed Maturity Securities) — ABS” in Note 3 of the Notes to the Consolidated Financial
Statements for a table that presents the Company’s ABS by collateral type, portion rated Aaa/AAA, portion rated NAIC 1, and portion credit
enhanced held by the Company at December 31, 2010 and 2009.
The slowing U.S. housing market, greater use of affordable mortgage products and relaxed underwriting standards for some originators of
sub-prime mortgage loans have recently led to higher delinquency and loss rates, especially within the 2006 and 2007 vintage years. These
factors have caused a pull-back in market liquidity and repricing of risk, which has led to higher levels of unrealized losses on securities
backed by sub-prime mortgage loans as compared to historical levels. However, in 2010, market conditions improved, credit spreads
narrowed on mortgage-backed and asset-backed securities and net unrealized losses on ABS backed by sub-prime mortgage loans
decreased from 36% to 22% of amortized cost from December 31, 2009 to December 31, 2010.
ABS in which the present value of projected future cash flows expected to be collected is less than amortized cost are reviewed for
impairment in accordance with our impairment policy. Based upon the analysis of the Company’s ABS, including sub-prime mortgage loans
through its exposure to ABS, the Company expects to receive payments in accordance with the contractual terms of the securities that are
considered temporarily impaired.
See “Investments— Fixed Maturity and Equity Securities Available-for-Sale — Concentrations of Credit Risk (Fixed Maturity Securities) —
ABS” in Note 3 of the Notes to the Consolidated Financial Statements for tables that present the Company’s holdings of ABS supported by
sub-prime mortgage loans by rating agency designation and by vintage year and by NAIC rating at December 31, 2010 and 2009.
The Company had ABS supported by sub-prime mortgage loans with estimated fair values of $1,119 million and $1,044 million and
unrealized losses of $317 million and $593 million at December 31, 2010 and 2009, respectively. Approximately 54% of this portfolio was
rated Aa or better, of which 88% was in vintage year 2005 and prior at December 31, 2010. Approximately 61% of this portfolio was rated Aa or
better, of which 91% was in vintage year 2005 and prior at December 31, 2009. These older vintages from 2005 and prior benefit from better
underwriting, improved enhancement levels and higher residential property price appreciation. All of the $1,119 million and $1,044 million of
ABS supported by sub-prime mortgage loans were classified as Level 3 fixed maturity securities in the fair value hierarchy at December 31,
2010 and 2009, respectively.
ABS also include collateralized debt obligations backed by sub-prime mortgage loans at an aggregate cost of $18 million with an
estimated fair value of $17 million at December 31, 2010 and an aggregate cost of $22 million with an estimated fair value of $8 million at
December 31, 2009.
Evaluating Available-for-Sale Securities for Other-Than-Temporary Impairment
See “Investments — Evaluating Available-for-Sale Securities for Other-Than-Temporary Impairment” in Note 3 of the Notes to the
Consolidated Financial Statements for a discussion of the regular evaluation of available-for-sale securities holdings in accordance with
our impairment policy, whereby we evaluate whether such investments are other-than-temporarily impaired, new OTTI guidance adopted in
2009 and factors considered by security classification in the regular OTTI evaluation.
See “— Summary of Critical Accounting Estimates.”
Net Unrealized Investment Gains (Losses)
See “Investments — Net Unrealized Investment Gains (Losses)” in Note 3 of the Notes to the Consolidated Financial Statements for the
components of net unrealized investment gains (losses), included in accumulated other comprehensive income (loss) and the changes in net
unrealized investment gains (losses) at December 31, 2010 and 2009 and for the years ended December 31, 2010, 2009 and 2008,
respectively.
Fixed maturity securities with noncredit OTTI losses in accumulated other comprehensive income (loss) of ($601) million at December 31,
2010, includes ($859) million recognized prior to January 1, 2010, ($212) million (($202) million, net of DAC) of noncredit OTTI losses
recognized in the year ended December 31, 2010, $16 million transferred to retained earnings in connection with the adoption of guidance
relatedtotheconsolidationofVIEs(seeNote1oftheNotestotheConsolidated Financial Statements) for the year ended December 31, 2010,
$137 million related to securities sold for the year ended December 31, 2010, for which a noncredit OTTI loss was previously recognized in
accumulated other comprehensive income (loss) and $317 million of subsequent increases in estimated fair value during the year ended
48 MetLife, Inc.