MetLife 2010 Annual Report Download - page 10
Download and view the complete annual report
Please find page 10 of the 2010 MetLife annual report below. You can navigate through the pages in the report by either clicking on the pages listed below, or by using the keyword search tool below to find specific information within the annual report.-
 1
1 -
 2
2 -
 3
3 -
 4
4 -
 5
5 -
 6
6 -
 7
7 -
 8
8 -
 9
9 -
 10
10 -
 11
11 -
 12
12 -
 13
13 -
 14
14 -
 15
15 -
 16
16 -
 17
17 -
 18
18 -
 19
19 -
 20
20 -
 21
21 -
22
-
23
-
24
-
25
-
26
-
27
-
28
-
29
-
30
-
31
-
32
-
33
-
34
-
35
-
36
-
37
-
38
-
39
-
40
-
41
-
42
-
43
-
44
-
45
-
46
-
47
-
48
-
49
-
50
-
51
-
52
-
53
-
54
-
55
-
56
-
57
-
58
-
59
-
60
-
61
-
62
-
63
-
64
-
65
-
66
-
67
-
68
-
69
-
70
-
71
-
72
-
73
-
74
-
75
-
76
-
77
-
78
-
79
-
80
-
81
-
82
-
83
-
84
-
85
-
86
-
87
-
88
-
89
-
90
-
91
-
92
-
93
-
94
-
95
-
96
-
97
-
98
-
99
-
100
-
101
-
102
-
103
-
104
-
105
-
106
-
107
-
108
-
109
-
110
-
111
-
112
-
113
-
114
-
115
-
116
-
117
-
118
-
119
-
120
-
121
-
122
-
123
-
124
-
125
-
126
-
127
-
128
-
129
-
130
-
131
-
132
-
133
-
134
-
135
-
136
-
137
-
138
-
139
-
140
-
141
-
142
-
143
-
144
-
145
-
146
-
147
-
148
-
149
-
150
-
151
-
152
-
153
-
154
-
155
-
156
-
157
-
158
-
159
-
160
-
161
-
162
-
163
-
164
-
165
-
166
-
167
-
168
-
169
-
170
-
171
-
172
-
173
-
174
-
175
-
176
-
177
-
178
-
179
-
180
-
181
-
182
-
183
-
184
-
185
-
186
-
187
-
188
-
189
-
190
-
191
-
192
-
193
-
194
-
195
-
196
-
197
-
198
-
199
-
200
-
201
-
202
-
203
-
204
-
205
-
206
-
207
-
208
-
209
-
210
-
211
-
212
-
213
-
214
-
215
-
216
-
217
-
218
-
219
-
220
-
221
-
222
-
223
-
224
-
225
-
226
-
227
-
228
-
229
-
230
-
231
-
232
-
233
-
234
-
235
-
236
-
237
-
238
-
239
-
240
-
241
-
242
 |
 |

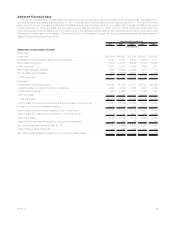
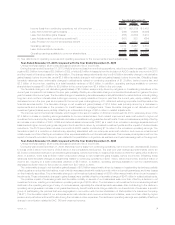
2010 2009 2008
Years Ended December 31,
(In millions)
Income(loss)fromcontinuingoperations,netofincometax................ $2,777 $(2,319) $3,479
Less:Netinvestmentgains(losses)................................ (392) (2,906) (2,098)
Less:Netderivativegains(losses) ................................ (265) (4,866) 3,910
Less:Adjustmentstocontinuingoperations(1)......................... (981) 283 (664)
Less:Provisionforincometax(expense)benefit ....................... 401 2,683 (488)
Operatingearnings .......................................... 4,014 2,487 2,819
Less:Preferredstockdividends .................................. 122 122 125
Operatingearningsavailabletocommonshareholders.................... $3,892 $2,365 $2,694
(1) See definitions of operating revenues and operating expenses for the components of such adjustments.
Year Ended December 31, 2010 compared with the Year Ended December 31, 2009
Unless otherwise stated, all amounts discussed below are net of income tax.
During the year ended December 31, 2010, MetLife’s income (loss) from continuing operations, net of income tax increased $5.1 billion to
a gain of $2.8 billion from a loss of $2.3 billion in 2009, of which $2 million in losses is from the inclusion of ALICO results for one month in 2010
and the impact of financing costs for the Acquisition. The change was predominantly due to a $4.6 billion favorable change in net derivative
gains (losses), before income tax, and a $2.5 billion favorable change in net investment gains (losses), before income tax. Offsetting these
favorable variances were unfavorable changes in adjustments related to continuing operations of $1.3 billion, before income tax, and
$2.2 billion of income tax, resulting in a total favorable variance of $3.6 billion. In addition, operating earnings available to common
shareholders increased $1.5 billion to $3.9 billion in the current year from $2.4 billion in the prior year.
The favorable change in net derivative gains (losses) of $3.0 billion was primarily driven by net gains on freestanding derivatives in the
current year compared to net losses in the prior year, partially offset by an unfavorable change in embedded derivatives from gains in the prior
year to losses in the current year. The favorable change in freestanding derivatives was primarily attributable to market factors, including falling
long-term and mid-term interest rates, a stronger recovery in equity markets in the prior year than the current year, equity volatility, which
decreased more in the prior year as compared to the current year, a strengthening U.S. dollar and widening corporate credit spreads in the
financial services sector. The favorable change in net investment gains (losses) of $1.6 billion was primarily driven by a decrease in
impairments and a decrease in the provision for credit losses on mortgage loans. These favorable changes in net derivative and net
investment gains (losses) were partially offset by an unfavorable change of $514 million in related adjustments.
The improvement in the financial markets, which began in the second quarter of 2009 and continued into 2010, was a key driver of the
$1.5 billion increase in operating earnings available to common shareholders. Such market improvement was most evident in higher net
investment income and policy fees, as well as a decrease in variable annuity guarantee benefit costs. These increases were partially offset by
an increase in amortization of DAC, VOBA and deferred sales inducements (“DSI”) as a result of an increase in average separate account
balances and higher current year gross margins in the closed block driven by increased investment yields and the impact of dividend scale
reductions. The 2010 period also includes one month of ALICO results, contributing $114 million to the increase in operating earnings. The
favorable impact of a reduction in discretionary spending associated with our enterprise-wide cost reduction and revenue enhancement
initiative was more than offset by an increase in other expenses related to our International business. This increase primarily stemmed from the
impact of a benefit recorded in the prior year related to the pesification in Argentina, as well as current year business growth in the segment.
Year Ended December 31, 2009 compared with the Year Ended December 31, 2008
Unless otherwise stated, all amounts discussed below are net of income tax.
During the year ended December 31, 2009, MetLife’s income (loss) from continuing operations, net of income tax, decreased $5.8 billion
to a loss of $2.3 billion from income of $3.5 billion in the comparable 2008 period. The year over year change is predominantly due to an
$8.8 billion unfavorable change in net derivative gains (losses), before income tax, to losses of $4.9 billion in 2009 from gains of $3.9 billion in
2008. In addition, there was an $808 million unfavorable change in net investment gains (losses), before income tax. Offsetting these
variances were favorable changes in adjustments related to continuing operations of $947 million, before income tax, and $3.2 billion of
income tax, resulting in a total unfavorable variance of $5.5 billion. In addition, operating earnings available to common shareholders
decreased by $329 million to $2.4 billion in 2009 from $2.7 billion in 2008.
The unfavorable change in net derivative gains (losses) of $8.8 billion was primarily driven by losses on freestanding derivatives, partially
offset by gains on embedded derivatives, most of which were associated with variable annuity minimum benefit guarantees, and lower losses
on fixed maturity securities. The unfavorable change in net investment gains (losses) of $808 million was primarily driven by an increase in
impairments. These unfavorable changes in gains (losses) were partially offset by a favorable change of $947 million in related adjustments.
The positive impact of business growth and favorable mortality in several of our businesses was more than offset by a decline in net
investment income, resulting in a decrease in operating earnings of $329 million. The decrease in net investment income caused significant
declines in the operating earnings of many of our businesses, especially the interest spread businesses. Also contributing to the decline in
operating earnings was an increase in net guaranteed annuity benefit costs and a charge related to our closed block of business, a specific
group of participating life policies that were segregated in connection with the demutualization of Metropolitan Life Insurance Company
(“MLIC”). The favorable impact of our enterprise-wide cost reduction and revenue enhancement initiative, was more than offset by higher
pension and postretirement benefit costs, driving the increase in other expenses. The declines in operating earnings were partially offset by a
change in amortization related to DAC, DSI and unearned revenue.
7MetLife, Inc.