MetLife 2010 Annual Report Download - page 124
Download and view the complete annual report
Please find page 124 of the 2010 MetLife annual report below. You can navigate through the pages in the report by either clicking on the pages listed below, or by using the keyword search tool below to find specific information within the annual report.-
 1
1 -
2
-
3
-
4
-
5
-
6
-
7
-
8
-
9
-
10
-
11
-
12
-
13
-
14
-
15
-
16
-
17
-
18
-
19
-
20
-
21
-
22
-
23
-
24
-
25
-
26
-
27
-
28
-
29
-
30
-
31
-
32
-
33
-
34
-
35
-
36
-
37
-
38
-
39
-
40
-
41
-
42
-
43
-
44
-
45
-
46
-
47
-
48
-
49
-
50
-
51
-
52
-
53
-
54
-
55
-
56
-
57
-
58
-
59
-
60
-
61
-
62
-
63
-
64
-
65
-
66
-
67
-
68
-
69
-
70
-
71
-
72
-
73
-
74
-
75
-
76
-
77
-
78
-
79
-
80
-
81
-
82
-
83
-
84
-
85
-
86
-
87
-
88
-
89
-
90
-
91
-
92
-
93
-
94
-
95
-
96
-
97
-
98
-
99
-
100
-
101
-
102
-
103
-
104
-
105
-
106
-
107
-
108
-
109
-
110
-
111
-
112
-
113
-
 114
114 -
 115
115 -
 116
116 -
 117
117 -
 118
118 -
 119
119 -
 120
120 -
 121
121 -
 122
122 -
 123
123 -
 124
124 -
 125
125 -
 126
126 -
 127
127 -
 128
128 -
 129
129 -
 130
130 -
 131
131 -
 132
132 -
 133
133 -
 134
134 -
135
-
136
-
137
-
138
-
139
-
140
-
141
-
142
-
143
-
144
-
145
-
146
-
147
-
148
-
149
-
150
-
151
-
152
-
153
-
154
-
155
-
156
-
157
-
158
-
159
-
160
-
161
-
162
-
163
-
164
-
165
-
166
-
167
-
168
-
169
-
170
-
171
-
172
-
173
-
174
-
175
-
176
-
177
-
178
-
179
-
180
-
181
-
182
-
183
-
184
-
185
-
186
-
187
-
188
-
189
-
190
-
191
-
192
-
193
-
194
-
195
-
196
-
197
-
198
-
199
-
200
-
201
-
202
-
203
-
204
-
205
-
206
-
207
-
208
-
209
-
210
-
211
-
212
-
213
-
214
-
215
-
216
-
217
-
218
-
219
-
220
-
221
-
222
-
223
-
224
-
225
-
226
-
227
-
228
-
229
-
230
-
231
-
232
-
233
-
234
-
235
-
236
-
237
-
238
-
239
-
240
-
241
-
242
 |
 |

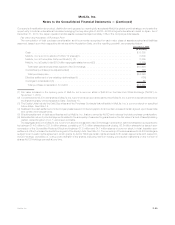
Cost or
Amortized
Cost Gain Temporary
Loss OTTI
Loss
Estimated
Fair
Value %of
Total
Gross Unrealized
December 31, 2009
(In millions)
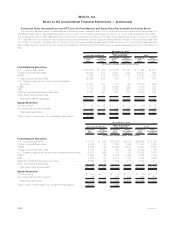
Fixed Maturity Securities:
U.S. corporate securities . . . . . . . . . . . . . . . . . . . . $ 72,075 $2,821 $2,699 $ 10 $ 72,187 31.7%
Foreign corporate securities . . . . . . . . . . . . . . . . . . 37,254 2,011 1,226 9 38,030 16.7
RMBS ................................ 45,343 1,234 1,957 600 44,020 19.3
Foreign government securities . . . . . . . . . . . . . . . . . 11,010 1,076 139 — 11,947 5.2
U.S. Treasury, agency and government guaranteed
securities(1) ........................... 25,712 745 1,010 — 25,447 11.2
CMBS ................................ 16,555 191 1,106 18 15,622 6.9
ABS.................................. 14,272 189 1,077 222 13,162 5.8
State and political subdivision securities . . . . . . . . . . 7,468 151 411 — 7,208 3.2
Otherfixedmaturitysecurities ................. 20 1 2 — 19 —
Total fixed maturity securities(2), (3) . . . . . . . . . . . . $229,709 $8,419 $9,627 $859 $227,642 100.0%
Equity Securities:
Commonstock........................... $ 1,537 $ 92 $ 8 $ — $ 1,621 52.6%
Non-redeemable preferred stock(2). . . . . . . . . . . . . . 1,650 80 267 — 1,463 47.4
Total equity securities(4) . . . . . . . . . . . . . . . . . . . $ 3,187 $ 172 $ 275 $ — $ 3,084 100.0%
(1) The Company has classified within the U.S. Treasury, agency and government guaranteed securities caption certain corporate fixed
maturity securities issued by U.S. financial institutions that were guaranteed by the Federal Deposit Insurance Corporation (“FDIC”)
pursuant to the FDIC’s Temporary Liquidity Guarantee Program (“FDIC Program”) of $223 million and $407 million at estimated fair value
with unrealized gains of $4 million and $2 million at December 31, 2010 and 2009, respectively.
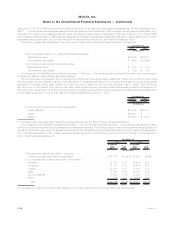
(2) Upon acquisition, the Company classifies perpetual securities that have attributes of both debt and equity as fixed maturity securities if
the security has an interest rate step-up feature which, when combined with other qualitative factors, indicates that the security has more
debt-like characteristics. The Company classifies perpetual securities with an interest rate step-up feature which, when combined with
other qualitative factors, indicates that the security has more equity-like characteristics, as equity securities within non-redeemable
preferred stock. Many of such securities have been issued by non-U.S. financial institutions that are accorded Tier 1 and Upper Tier 2
capital treatment by their respective regulatory bodies and are commonly referred to as “perpetual hybrid securities.” The following table
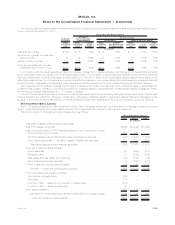
presents the perpetual hybrid securities held by the Company at:
Consolidated Balance Sheets Sector Table Primary Issuers
Estimated
Fair
Value
Estimated
Fair
Value
Classification
2010 2009
December 31,
(In millions)
Equity securities Non-redeemable preferred stock Non-U.S. financial institutions $1,046 $ 988
Equity securities Non-redeemable preferred stock U.S. financial institutions $ 236 $ 349
Fixed maturity securities Foreign corporate securities Non-U.S. financial institutions $2,038 $2,626
Fixed maturity securities U.S. corporate securities U.S. financial institutions $ 83 $ 91
(3) The Company’s holdings in redeemable preferred stock with stated maturity dates, commonly referred to as “capital securities”, were
primarily issued by U.S. financial institutions and have cumulative interest deferral features. The Company held $2.7 billion and
$2.5 billion at estimated fair value of such securities at December 31, 2010 and 2009, respectively, which are included in the U.S. and
foreign corporate securities sectors within fixed maturity securities.
(4) Equity securities primarily consist of investments in common and preferred stocks, including certain perpetual hybrid securities and
mutual fund interests. Privately-held equity securities were $1.3 billion and $1.0 billion at estimated fair value at December 31, 2010 and
2009, respectively.
The Company held foreign currency derivatives with notional amounts of $12.2 billion and $9.1 billion to hedge the exchange rate risk
associated with foreign denominated fixed maturity securities at December 31, 2010 and 2009, respectively.
The below investment grade and non-income producing amounts presented below are based on rating agency designations and
equivalent designations of the National Association of Insurance Commissioners (“NAIC”), with the exception of certain structured securities
described below held by the Company’s insurance subsidiaries that file NAIC statutory financial statements. Non-agency RMBS, including
RMBS backed by sub-prime mortgage loans reported within ABS, CMBS and all other ABS held by the Company’s insurance subsidiaries that
file NAIC statutory financial statements are presented based on final ratings from the revised NAIC rating methodologies which became
effective December 31, 2009 for non-agency RMBS, including RMBS backed by sub-prime mortgage loans reported within ABS, and
F-35MetLife, Inc.
MetLife, Inc.
Notes to the Consolidated Financial Statements — (Continued)