MetLife 2010 Annual Report Download - page 131
Download and view the complete annual report
Please find page 131 of the 2010 MetLife annual report below. You can navigate through the pages in the report by either clicking on the pages listed below, or by using the keyword search tool below to find specific information within the annual report.-
 1
1 -
2
-
3
-
4
-
5
-
6
-
7
-
8
-
9
-
10
-
11
-
12
-
13
-
14
-
15
-
16
-
17
-
18
-
19
-
20
-
21
-
22
-
23
-
24
-
25
-
26
-
27
-
28
-
29
-
30
-
31
-
32
-
33
-
34
-
35
-
36
-
37
-
38
-
39
-
40
-
41
-
42
-
43
-
44
-
45
-
46
-
47
-
48
-
49
-
50
-
51
-
52
-
53
-
54
-
55
-
56
-
57
-
58
-
59
-
60
-
61
-
62
-
63
-
64
-
65
-
66
-
67
-
68
-
69
-
70
-
71
-
72
-
73
-
74
-
75
-
76
-
77
-
78
-
79
-
80
-
81
-
82
-
83
-
84
-
85
-
86
-
87
-
88
-
89
-
90
-
91
-
92
-
93
-
94
-
95
-
96
-
97
-
98
-
99
-
100
-
101
-
102
-
103
-
104
-
105
-
106
-
107
-
108
-
109
-
110
-
111
-
112
-
113
-
114
-
115
-
116
-
117
-
118
-
119
-
120
-
 121
121 -
 122
122 -
 123
123 -
 124
124 -
 125
125 -
 126
126 -
 127
127 -
 128
128 -
 129
129 -
 130
130 -
 131
131 -
 132
132 -
 133
133 -
 134
134 -
 135
135 -
 136
136 -
 137
137 -
 138
138 -
 139
139 -
 140
140 -
 141
141 -
142
-
143
-
144
-
145
-
146
-
147
-
148
-
149
-
150
-
151
-
152
-
153
-
154
-
155
-
156
-
157
-
158
-
159
-
160
-
161
-
162
-
163
-
164
-
165
-
166
-
167
-
168
-
169
-
170
-
171
-
172
-
173
-
174
-
175
-
176
-
177
-
178
-
179
-
180
-
181
-
182
-
183
-
184
-
185
-
186
-
187
-
188
-
189
-
190
-
191
-
192
-
193
-
194
-
195
-
196
-
197
-
198
-
199
-
200
-
201
-
202
-
203
-
204
-
205
-
206
-
207
-
208
-
209
-
210
-
211
-
212
-
213
-
214
-
215
-
216
-
217
-
218
-
219
-
220
-
221
-
222
-
223
-
224
-
225
-
226
-
227
-
228
-
229
-
230
-
231
-
232
-
233
-
234
-
235
-
236
-
237
-
238
-
239
-
240
-
241
-
242
 |
 |

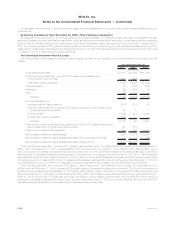
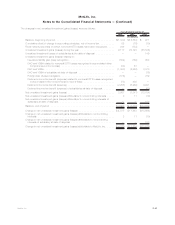
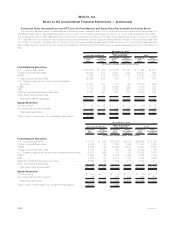
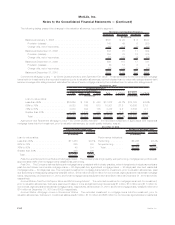
Continuous Gross Unrealized Loss and OTTI Loss for Fixed Maturity and Equity Securities Available-for-Sale by Sector
The following tables present the estimated fair value and gross unrealized loss of the Company’s fixed maturity and equity securities in an
unrealized loss position, aggregated by sector and by length of time that the securities have been in a continuous unrealized loss position.
The unrealized loss amounts presented below include the noncredit component of OTTI loss. Fixed maturity securities on which a noncredit
OTTI loss has been recognized in accumulated other comprehensive income (loss) are categorized by length of time as being “less than
12 months” or “equal to or greater than 12 months” in a continuous unrealized loss position based on the point in time that the estimated fair
value initially declined to below the amortized cost basis and not the period of time since the unrealized loss was deemed a noncredit OTTI
loss.
Estimated
Fair
Value
Gross
Unrealized
Loss
Estimated
Fair
Value
Gross
Unrealized
Loss
Estimated
Fair
Value
Gross
Unrealized
Loss
Less than 12 Months Equal to or Greater
than 12 Months Total
December 31, 2010
(In millions, except number of securities)
Fixed Maturity Securities:
U.S. corporate securities . . . . . . . . . . . . . . . . . . . . . . . . $ 23,309 $ 464 $ 8,386 $1,167 $ 31,695 $1,631
Foreign corporate securities . . . . . . . . . . . . . . . . . . . . . . 22,530 417 4,007 522 26,537 939
RMBS..................................... 7,588 212 6,700 1,175 14,288 1,387
Foreign government securities . . . . . . . . . . . . . . . . . . . . . 26,828 593 189 17 27,017 610
U.S. Treasury, agency and government guaranteed
securities................................. 13,401 530 118 29 13,519 559
CMBS .................................... 3,787 29 1,363 249 5,150 278
ABS...................................... 2,713 42 3,029 667 5,742 709
State and political subdivision securities . . . . . . . . . . . . . . 5,061 246 988 272 6,049 518
Otherfixedmaturitysecurities ..................... 1 — — — 1 —
Total fixed maturity securities . . . . . . . . . . . . . . . . . . . . $105,218 $2,533 $24,780 $4,098 $129,998 $6,631
Equity Securities:
Commonstock............................... $ 89 $ 12 $ 1 $ — $ 90 $ 12
Non-redeemable preferred stock . . . . . . . . . . . . . . . . . . . 191 9 824 220 1,015 229
Totalequitysecurities ......................... $ 280 $ 21 $ 825 $ 220 $ 1,105 $ 241
Total number of securities in an unrealized loss position . . . . 5,793 1,738
Estimated
Fair
Value
Gross
Unrealized
Loss
Estimated
Fair
Value
Gross
Unrealized
Loss
Estimated
Fair
Value
Gross
Unrealized
Loss
Less than 12 Months Equal to or Greater
than 12 Months Total
December 31, 2009
(In millions, except number of securities)
Fixed Maturity Securities:
U.S. corporate securities . . . . . . . . . . . . . . . . . . . . . . . . . $ 8,641 $ 395 $18,004 $2,314 $26,645 $ 2,709
Foreign corporate securities. . . . . . . . . . . . . . . . . . . . . . . . 3,786 139 7,282 1,096 11,068 1,235
RMBS...................................... 5,623 119 10,268 2,438 15,891 2,557
Foreigngovernmentsecurities ...................... 2,318 55 507 84 2,825 139
U.S. Treasury, agency and government guaranteed securities . . 15,051 990 51 20 15,102 1,010
CMBS...................................... 2,052 29 5,435 1,095 7,487 1,124
ABS....................................... 1,259 143 5,875 1,156 7,134 1,299
State and political subdivision securities . . . . . . . . . . . . . . . . 2,086 94 1,843 317 3,929 411
Otherfixedmaturitysecurities ...................... 6 2 — — 6 2
Total fixed maturity securities . . . . . . . . . . . . . . . . . . . . . . $40,822 $1,966 $49,265 $8,520 $90,087 $10,486
Equity Securities:
Commonstock................................ $ 56 $ 7 $ 14 $ 1 $ 70 $ 8
Non-redeemable preferred stock . . . . . . . . . . . . . . . . . . . . 66 41 930 226 996 267
Totalequitysecurities .......................... $ 122 $ 48 $ 944 $ 227 $ 1,066 $ 275
Total number of securities in an unrealized loss position . . . . . . 2,210 3,333
F-42 MetLife, Inc.
MetLife, Inc.
Notes to the Consolidated Financial Statements — (Continued)