MetLife 2010 Annual Report Download - page 212
Download and view the complete annual report
Please find page 212 of the 2010 MetLife annual report below. You can navigate through the pages in the report by either clicking on the pages listed below, or by using the keyword search tool below to find specific information within the annual report.-
 1
1 -
2
-
3
-
4
-
5
-
6
-
7
-
8
-
9
-
10
-
11
-
12
-
13
-
14
-
15
-
16
-
17
-
18
-
19
-
20
-
21
-
22
-
23
-
24
-
25
-
26
-
27
-
28
-
29
-
30
-
31
-
32
-
33
-
34
-
35
-
36
-
37
-
38
-
39
-
40
-
41
-
42
-
43
-
44
-
45
-
46
-
47
-
48
-
49
-
50
-
51
-
52
-
53
-
54
-
55
-
56
-
57
-
58
-
59
-
60
-
61
-
62
-
63
-
64
-
65
-
66
-
67
-
68
-
69
-
70
-
71
-
72
-
73
-
74
-
75
-
76
-
77
-
78
-
79
-
80
-
81
-
82
-
83
-
84
-
85
-
86
-
87
-
88
-
89
-
90
-
91
-
92
-
93
-
94
-
95
-
96
-
97
-
98
-
99
-
100
-
101
-
102
-
103
-
104
-
105
-
106
-
107
-
108
-
109
-
110
-
111
-
112
-
113
-
114
-
115
-
116
-
117
-
118
-
119
-
120
-
121
-
122
-
123
-
124
-
125
-
126
-
127
-
128
-
129
-
130
-
131
-
132
-
133
-
134
-
135
-
136
-
137
-
138
-
139
-
140
-
141
-
142
-
143
-
144
-
145
-
146
-
147
-
148
-
149
-
150
-
151
-
152
-
153
-
154
-
155
-
156
-
157
-
158
-
159
-
160
-
161
-
162
-
163
-
164
-
165
-
166
-
167
-
168
-
169
-
170
-
171
-
172
-
173
-
174
-
175
-
176
-
177
-
178
-
179
-
180
-
181
-
182
-
183
-
184
-
185
-
186
-
187
-
188
-
189
-
190
-
191
-
192
-
193
-
194
-
195
-
196
-
197
-
198
-
199
-
200
-
201
-
 202
202 -
 203
203 -
 204
204 -
 205
205 -
 206
206 -
 207
207 -
 208
208 -
 209
209 -
 210
210 -
 211
211 -
 212
212 -
 213
213 -
 214
214 -
 215
215 -
 216
216 -
 217
217 -
 218
218 -
 219
219 -
 220
220 -
 221
221 -
 222
222 -
223
-
224
-
225
-
226
-
227
-
228
-
229
-
230
-
231
-
232
-
233
-
234
-
235
-
236
-
237
-
238
-
239
-
240
-
241
-
242
 |
 |

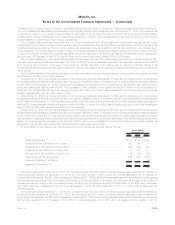
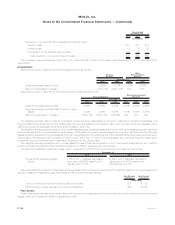
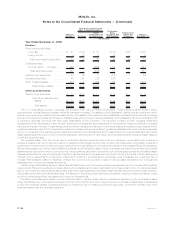
The components of net periodic benefit costs and other changes in plan assets and benefit obligations recognized in other compre-
hensive income (loss) were as follows:
2010 2009 2008 2010 2009 2008
Years Ended December 31,
Pension
Benefits
Other
Postretirement
Benefits
(In millions)
Net Periodic Benefit Costs:
Servicecosts ..........................................$180$170$ 164$ 17$ 22$ 21
Interestcosts .......................................... 399 395 379 113 125 103
Settlementandcurtailmentcosts.............................. 8 17 — 1 — —
Expectedreturnonplanassets............................... (450) (439) (517) (79) (72) (86)
Amortizationofnetactuarial(gains)losses........................ 196 227 24 38 42 (1)
Amortizationofpriorservicecosts(credit) ........................ 7 10 15 (83) (36) (37)
Netperiodicbenefitcosts................................. 340 380 65 7 81 —
Netperiodicbenefitcostsofsubsidiaryatdateofdisposal............ — — 1 — — —
Totalnetperiodicbenefitcosts.............................. 340 380 66 7 81 —
Other Changes in Plan Assets and Benefit Obligations Recognized in
Other Comprehensive Income (Loss):
Netactuarial(gains)losses.................................. 22 310 1,561 50 283 259
Priorservicecosts(credit) .................................. 1 (10) (19) (80) (167) 36
Amortizationofnetactuarialgains(losses)........................ (196) (227) (24) (38) (42) 1
Amortizationofpriorservice(costs)credit ........................ (7) (10) (15) 83 36 37
Total recognized in other comprehensive income (loss) . . . . . . . . . . . . . . (180) 63 1,503 15 110 333
Total recognized in net periodic benefit costs and other comprehensive
income(loss)........................................$160$443$1,569$ 22$191$333
For the year ended December 31, 2010, included within other comprehensive income (loss) were other changes in plan assets and benefit
obligations associated with pension benefits of ($180) million and other postretirement benefits of $15 million for an aggregate reduction in
other comprehensive income (loss) of ($165) million before income tax and ($96) million, net of income tax.
The estimated net actuarial (gains) losses and prior service costs (credit) for the pension plans that will be amortized from accumulated
other comprehensive income (loss) into net periodic benefit costs over the next year are $176 million and $5 million, respectively.
The estimated net actuarial (gains) losses and prior service costs (credit) for the defined benefit other postretirement benefit plans that will
be amortized from accumulated other comprehensive income (loss) into net periodic benefit costs over the next year are $34 million and
($108) million, respectively.
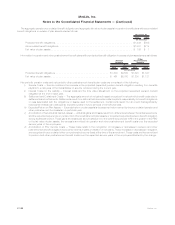
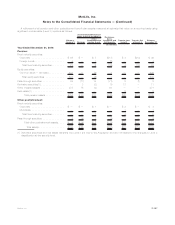
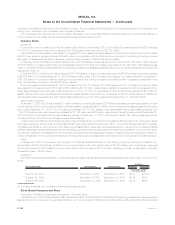
The Medicare Modernization Act of 2003 created various subsidies for sponsors of retiree drug programs. Two common ways of providing
subsidies were the Retiree Drug Subsidy (“RDS”) and Medicare Part D Prescription Drug Plans (“PDP”). From 2006 through 2010, the
Company applied for and received the RDS each year. The RDS program provides the subsidy through cash payments made by Medicare to
the Company, resulting in smaller net claims paid by the Company. A summary of the reduction to the APBO and the related reduction to the
components of net periodic other postretirement benefits plan costs resulting from receipt of the RDS is presented below. As of January 1,
2011, as a result of changes made under the Patient Protection and Affordable Care Act of 2010, the Company will no longer apply for the
RDS. Instead it has joined PDP and will indirectly receive Medicare subsidies in the form of smaller gross benefit payments for prescription
drug coverage.
2010 2009 2008
December 31,
(In millions)
Cumulative reduction in other postretirement benefits obligations:
BalanceatJanuary1, ............................................... $247 $317 $299
Servicecosts..................................................... 3 2 5
Interestcosts..................................................... 16 16 20
Netactuarialgains(losses)............................................ (255) (76) 3
Prescriptiondrugsubsidy............................................. (11) (12) (10)
BalanceatDecember31, ........................................... $ — $247 $317
F-123MetLife, Inc.
MetLife, Inc.
Notes to the Consolidated Financial Statements — (Continued)