MetLife 2010 Annual Report Download - page 214
Download and view the complete annual report
Please find page 214 of the 2010 MetLife annual report below. You can navigate through the pages in the report by either clicking on the pages listed below, or by using the keyword search tool below to find specific information within the annual report.-
 1
1 -
2
-
3
-
4
-
5
-
6
-
7
-
8
-
9
-
10
-
11
-
12
-
13
-
14
-
15
-
16
-
17
-
18
-
19
-
20
-
21
-
22
-
23
-
24
-
25
-
26
-
27
-
28
-
29
-
30
-
31
-
32
-
33
-
34
-
35
-
36
-
37
-
38
-
39
-
40
-
41
-
42
-
43
-
44
-
45
-
46
-
47
-
48
-
49
-
50
-
51
-
52
-
53
-
54
-
55
-
56
-
57
-
58
-
59
-
60
-
61
-
62
-
63
-
64
-
65
-
66
-
67
-
68
-
69
-
70
-
71
-
72
-
73
-
74
-
75
-
76
-
77
-
78
-
79
-
80
-
81
-
82
-
83
-
84
-
85
-
86
-
87
-
88
-
89
-
90
-
91
-
92
-
93
-
94
-
95
-
96
-
97
-
98
-
99
-
100
-
101
-
102
-
103
-
104
-
105
-
106
-
107
-
108
-
109
-
110
-
111
-
112
-
113
-
114
-
115
-
116
-
117
-
118
-
119
-
120
-
121
-
122
-
123
-
124
-
125
-
126
-
127
-
128
-
129
-
130
-
131
-
132
-
133
-
134
-
135
-
136
-
137
-
138
-
139
-
140
-
141
-
142
-
143
-
144
-
145
-
146
-
147
-
148
-
149
-
150
-
151
-
152
-
153
-
154
-
155
-
156
-
157
-
158
-
159
-
160
-
161
-
162
-
163
-
164
-
165
-
166
-
167
-
168
-
169
-
170
-
171
-
172
-
173
-
174
-
175
-
176
-
177
-
178
-
179
-
180
-
181
-
182
-
183
-
184
-
185
-
186
-
187
-
188
-
189
-
190
-
191
-
192
-
193
-
194
-
195
-
196
-
197
-
198
-
199
-
200
-
201
-
202
-
203
-
 204
204 -
 205
205 -
 206
206 -
 207
207 -
 208
208 -
 209
209 -
 210
210 -
 211
211 -
 212
212 -
 213
213 -
 214
214 -
 215
215 -
 216
216 -
 217
217 -
 218
218 -
 219
219 -
 220
220 -
 221
221 -
 222
222 -
 223
223 -
 224
224 -
225
-
226
-
227
-
228
-
229
-
230
-
231
-
232
-
233
-
234
-
235
-
236
-
237
-
238
-
239
-
240
-
241
-
242
 |
 |

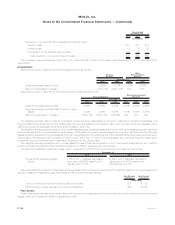
The underlying assets of the separate accounts are principally comprised of cash and cash equivalents, short-term investments, fixed
maturity and equity securities, mutual funds, real estate, private equity investments and hedge funds investments.
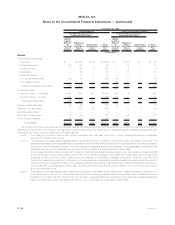
The comparative presentation of the 2009 plan assets has been realigned to conform to the 2010 presentation to disclose the estimated
fair value of the underlying assets of each separate account at the security level.
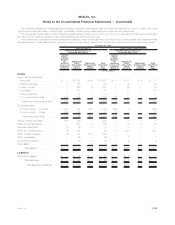
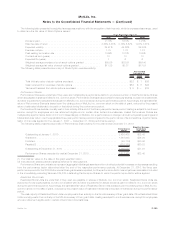
The pension and postretirement plan assets and liabilities measured at estimated fair value on a recurring basis were determined as
described below. These estimated fair values and their corresponding placement in the fair value hierarchy are summarized as follows:
Quoted
Prices
In Active
Markets
for
Identical
Assets and
Liabilities
(Level 1)
Significant
Other
Observable
Inputs
(Level 2)
Significant
Unobservable
Inputs
(Level 3)
Total
Estimated
Fair
Value
Quoted
Prices
In Active
Markets
for
Identical
Assets and
Liabilities
(Level 1)
Significant
Other
Observable
Inputs
(Level 2)
Significant
Unobservable
Inputs
(Level 3)
Total
Estimated
Fair
Value
Fair Value Measurements at
Reporting Date Using Fair Value Measurements at
Reporting Date Using
Pension Benefits Other Postretirement Benefits
December 31, 2010
(In millions)
Assets
Fixed maturity securities:
Corporate ................. $ — $1,528 $ 49 $1,577 $ — $ 67 $ 4 $ 71
Federalagencies............. — 175 — 175 — 15 — 15
Foreignbonds............... 1 222 4 227 — 19 — 19
Municipals ................. — 137 — 137 — 37 1 38
Preferredstocks ............. — 4 — 4 — — — —
U.S. government bonds . . . . . . . . 650 136 — 786 82 — — 82
Total fixed maturity securities . . . . 651 2,202 53 2,906 82 138 5 225
Equity securities:
Common stock — domestic . . . . . . 1,410 93 240 1,743 359 3 — 362
Common stock — foreign . . . . . . . 469 35 — 504 77 — — 77
Total equity securities . . . . . . . . 1,879 128 240 2,247 436 3 — 439
Money market securities . . . . . . . . . . 200 100 — 300 1 1 — 2
Pass-throughsecurities.......... — 321 2 323 — 73 6 79
Derivativesecurities ............ 3 (5) 11 9 — — — —
Short-term investments . . . . . . . . . . (9) 105 — 96 8 443 — 451
Otherinvestedassets ........... 16 63 471 550 — — — —
Otherreceivables.............. — 39 — 39 — 3 — 3
Securitiesreceivable............ — 70 — 70 — 2 — 2
Realestate .................. — — 8 8 — — — —
Total assets . . . . . . . . . . . . . $2,740 $3,023 $785 $6,548 $527 $663 $11 $1,201
Liabilities
Securitiespayable ............. $ — $ 60 $ — $ 60 $ — $ 1 $— $ 1
Totalliabilities ............ $ — $ 60 $ — $ 60 $ — $ 1 $— $ 1
Total assets and liabilities . . . $2,740 $2,963 $785 $6,488 $527 $662 $11 $1,200
F-125MetLife, Inc.
MetLife, Inc.
Notes to the Consolidated Financial Statements — (Continued)