MetLife 2010 Annual Report Download - page 59
Download and view the complete annual report
Please find page 59 of the 2010 MetLife annual report below. You can navigate through the pages in the report by either clicking on the pages listed below, or by using the keyword search tool below to find specific information within the annual report.-
 1
1 -
2
-
3
-
4
-
5
-
6
-
7
-
8
-
9
-
10
-
11
-
12
-
13
-
14
-
15
-
16
-
17
-
18
-
19
-
20
-
21
-
22
-
23
-
24
-
25
-
26
-
27
-
28
-
29
-
30
-
31
-
32
-
33
-
34
-
35
-
36
-
37
-
38
-
39
-
40
-
41
-
42
-
43
-
44
-
45
-
46
-
47
-
48
-
 49
49 -
 50
50 -
 51
51 -
 52
52 -
 53
53 -
 54
54 -
 55
55 -
 56
56 -
 57
57 -
 58
58 -
 59
59 -
 60
60 -
 61
61 -
 62
62 -
 63
63 -
 64
64 -
 65
65 -
 66
66 -
 67
67 -
 68
68 -
 69
69 -
70
-
71
-
72
-
73
-
74
-
75
-
76
-
77
-
78
-
79
-
80
-
81
-
82
-
83
-
84
-
85
-
86
-
87
-
88
-
89
-
90
-
91
-
92
-
93
-
94
-
95
-
96
-
97
-
98
-
99
-
100
-
101
-
102
-
103
-
104
-
105
-
106
-
107
-
108
-
109
-
110
-
111
-
112
-
113
-
114
-
115
-
116
-
117
-
118
-
119
-
120
-
121
-
122
-
123
-
124
-
125
-
126
-
127
-
128
-
129
-
130
-
131
-
132
-
133
-
134
-
135
-
136
-
137
-
138
-
139
-
140
-
141
-
142
-
143
-
144
-
145
-
146
-
147
-
148
-
149
-
150
-
151
-
152
-
153
-
154
-
155
-
156
-
157
-
158
-
159
-
160
-
161
-
162
-
163
-
164
-
165
-
166
-
167
-
168
-
169
-
170
-
171
-
172
-
173
-
174
-
175
-
176
-
177
-
178
-
179
-
180
-
181
-
182
-
183
-
184
-
185
-
186
-
187
-
188
-
189
-
190
-
191
-
192
-
193
-
194
-
195
-
196
-
197
-
198
-
199
-
200
-
201
-
202
-
203
-
204
-
205
-
206
-
207
-
208
-
209
-
210
-
211
-
212
-
213
-
214
-
215
-
216
-
217
-
218
-
219
-
220
-
221
-
222
-
223
-
224
-
225
-
226
-
227
-
228
-
229
-
230
-
231
-
232
-
233
-
234
-
235
-
236
-
237
-
238
-
239
-
240
-
241
-
242
 |
 |

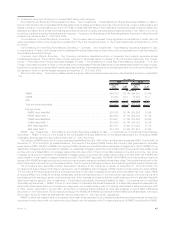
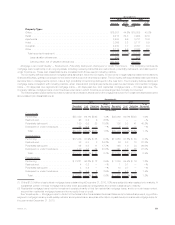
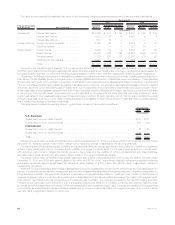
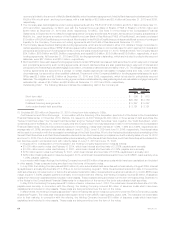
Fair Value Hierarchy. Derivatives measured at estimated fair value on a recurring basis and their corresponding fair value hierarchy, are
presented as follows:
Derivative
Assets Derivative
Liabilities
December 31, 2010
(In millions)
Quoted prices in active markets for identical assets and liabilities (Level 1) . . . . . . . . . $ 156 2% $ 45 1%
Significantotherobservableinputs(Level2) ............................ 7,176 92 4,245 93
Significantunobservableinputs(Level3)............................... 445 6 272 6
Totalestimatedfairvalue ....................................... $7,777 100% $4,562 100%
The valuation of Level 3 derivatives involves the use of significant unobservable inputs and generally requires a higher degree of
management judgment or estimation than the valuations of Level 1 and Level 2 derivatives. Although Level 3 inputs are based on assumptions
deemed appropriate given the circumstances and are assumed to be consistent with what other market participants would use when pricing
such instruments, the use of different inputs or methodologies could have a material effect on the estimated fair value of Level 3 derivatives
and could materially affect net income.
Derivatives categorized as Level 3 at December 31, 2010 include: interest rate forwards with maturities which extend beyond the
observable portion of the yield curve; interest rate lock commitments with certain unobservable inputs, including pull-through rates; equity
variance swaps with unobservable volatility inputs or that are priced via independent broker quotations; foreign currency swaps which are
cancelable and priced through independent broker quotations; interest rate swaps with maturities which extend beyond the observable
portion of the yield curve; credit default swaps based upon baskets of credits having unobservable credit correlations, as well as credit default
swaps with maturities which extend beyond the observable portion of the credit curves and credit default swaps priced through independent
broker quotes; foreign currency forwards priced via independent broker quotations or with liquidity adjustments; implied volatility swaps with
unobservable volatility inputs or that are priced via independent broker quotations; equity options with unobservable volatility inputs or that are
priced via independent broker quotations; currency options based upon baskets of currencies having unobservable currency correlations;
and credit forwards having unobservable repurchase rates.
At December 31, 2010 and 2009, 2.0% and 5.5%, respectively, of the net derivative estimated fair value was priced via independent
broker quotations.
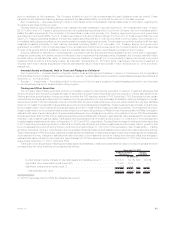
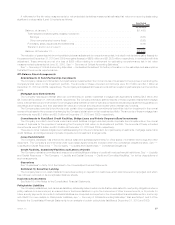
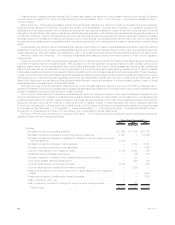
A rollforward of the fair value measurements for derivatives measured at estimated fair value on a recurring basis using significant
unobservable (Level 3) inputs for the year ended December 31, 2010 is as follows:
Year Ended
December 31, 2010
(In millions)
Balance,atJanuary1, .................................................... $356
Total realized/unrealized gains (losses) included in:
Earnings .......................................................... (5)
Othercomprehensiveincome(loss)......................................... (81)
Purchases,sales,issuancesandsettlements.................................... (75)
Transferinand/oroutofLevel3 ............................................ (22)
Balance,atDecember31,.................................................. $173
See “— Summary of Critical Accounting Estimates — Derivative Financial Instruments” for further information on the estimates and
assumptions that affect the amounts reported above.
Credit Risk. See Note 4 of the Notes to Consolidated Financial Statements for information about how the Company manages credit risk
related to its freestanding derivatives, including the use of master netting agreements and collateral arrangements.
Credit Derivatives. See Note 4 of the Notes to Consolidated Financial Statements for information about the estimated fair value and
maximum amount at risk related to the Company’s written credit default swaps.
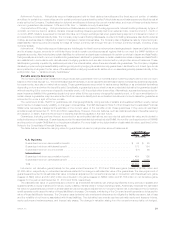
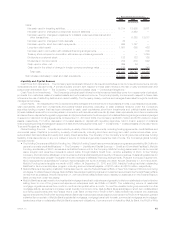
Embedded Derivatives. The embedded derivatives measured at estimated fair value on a recurring basis and their corresponding fair
value hierarchy, are presented as follows:
Asset Host
Contracts Liability Host
Contracts
Net Embedded Derivatives Within
December 31, 2010
(In millions)
Quoted prices in active markets for identical assets and liabilities (Level 1) . . . . . . . . $ — —% $ — —%
Significantotherobservableinputs(Level2)............................ — — 11 —
Significantunobservableinputs(Level3).............................. 185 100 2,623 100
Totalestimatedfairvalue........................................ $185 100% $2,634 100%
56 MetLife, Inc.