MetLife 2010 Annual Report Download - page 146
Download and view the complete annual report
Please find page 146 of the 2010 MetLife annual report below. You can navigate through the pages in the report by either clicking on the pages listed below, or by using the keyword search tool below to find specific information within the annual report.-
 1
1 -
2
-
3
-
4
-
5
-
6
-
7
-
8
-
9
-
10
-
11
-
12
-
13
-
14
-
15
-
16
-
17
-
18
-
19
-
20
-
21
-
22
-
23
-
24
-
25
-
26
-
27
-
28
-
29
-
30
-
31
-
32
-
33
-
34
-
35
-
36
-
37
-
38
-
39
-
40
-
41
-
42
-
43
-
44
-
45
-
46
-
47
-
48
-
49
-
50
-
51
-
52
-
53
-
54
-
55
-
56
-
57
-
58
-
59
-
60
-
61
-
62
-
63
-
64
-
65
-
66
-
67
-
68
-
69
-
70
-
71
-
72
-
73
-
74
-
75
-
76
-
77
-
78
-
79
-
80
-
81
-
82
-
83
-
84
-
85
-
86
-
87
-
88
-
89
-
90
-
91
-
92
-
93
-
94
-
95
-
96
-
97
-
98
-
99
-
100
-
101
-
102
-
103
-
104
-
105
-
106
-
107
-
108
-
109
-
110
-
111
-
112
-
113
-
114
-
115
-
116
-
117
-
118
-
119
-
120
-
121
-
122
-
123
-
124
-
125
-
126
-
127
-
128
-
129
-
130
-
131
-
132
-
133
-
134
-
135
-
 136
136 -
 137
137 -
 138
138 -
 139
139 -
 140
140 -
 141
141 -
 142
142 -
 143
143 -
 144
144 -
 145
145 -
 146
146 -
 147
147 -
 148
148 -
 149
149 -
 150
150 -
 151
151 -
 152
152 -
 153
153 -
 154
154 -
 155
155 -
 156
156 -
157
-
158
-
159
-
160
-
161
-
162
-
163
-
164
-
165
-
166
-
167
-
168
-
169
-
170
-
171
-
172
-
173
-
174
-
175
-
176
-
177
-
178
-
179
-
180
-
181
-
182
-
183
-
184
-
185
-
186
-
187
-
188
-
189
-
190
-
191
-
192
-
193
-
194
-
195
-
196
-
197
-
198
-
199
-
200
-
201
-
202
-
203
-
204
-
205
-
206
-
207
-
208
-
209
-
210
-
211
-
212
-
213
-
214
-
215
-
216
-
217
-
218
-
219
-
220
-
221
-
222
-
223
-
224
-
225
-
226
-
227
-
228
-
229
-
230
-
231
-
232
-
233
-
234
-
235
-
236
-
237
-
238
-
239
-
240
-
241
-
242
 |
 |

(1) Represents undiscounted principal and interest cash flow expectations, at the date of acquisition.
(2) A portion of the difference between the contractually required payments (including interest) and the cash flows expected to be collected
on certain of the investments acquired from American Life has been established as an indemnification asset as discussed further in
Note 2.
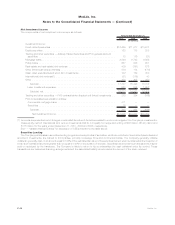
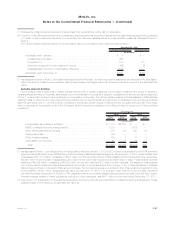
The following table presents activity for the accretable yield on purchased credit impaired investments for:
Fixed Maturity Securities Mortgage Loans
December 31, 2010
(In millions)
Accretableyield,January1,.................................. $ — $ —
Investmentspurchased ................................... 606 —
Acquisition(1).......................................... 100 173
Accretionrecognizedinnetinvestmentincome.................... (62) (3)
Reclassification(to)fromnonaccretabledifference.................. (103) —
Accretableyield,December31, ............................... $541 $170
(1) As described further in Note 2, all investments acquired with American Life were recorded at estimated fair value as of the Acquisition
Date. This activity relates to acquired fixed maturity securities and mortgage loans with a credit impairment inherent in the estimated fair
value.
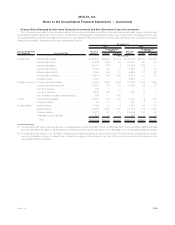
Variable Interest Entities
The Company holds investments in certain entities that are VIEs. In certain instances, the Company holds both the power to direct the
most significant activities of the entity, as well as an economic interest in the entity and, as such, consistent with the new guidance described
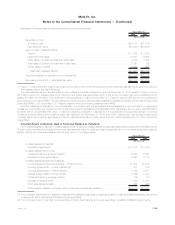
in Note 1, is deemed to be the primary beneficiary or consolidator of the entity. The following table presents the total assets and total liabilities
relating to VIEs for which the Company has concluded that it is the primary beneficiary and which are consolidated in the Company’s financial
statements at December 31, 2010 and 2009. Creditors or beneficial interest holders of VIEs where the Company is the primary beneficiary
have no recourse to the general credit of the Company, as the Company’s obligation to the VIEs is limited to the amount of its committed
investment.
Total
Assets Total
Liabilities Tot al
Assets Tot al
Liabilities
2010 2009
December 31,
(In millions)
Consolidatedsecuritizationentities(1) ......................... $ 7,114 $6,892 $ — $—
MRSCcollateralfinancingarrangement(2)....................... 3,333 — 3,230 —
Otherlimitedpartnershipinterests............................ 319 85 367 72
Tradingsecurities ...................................... 186 — — —
Otherinvestedassets.................................... 108 1 27 1
Realestatejointventures ................................. 20 17 22 17
Total ............................................. $11,080 $6,995 $3,646 $90
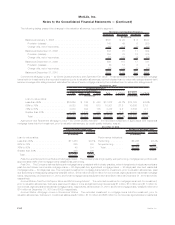
(1) As discussed in Note 1, upon the adoption of new guidance effective January 1, 2010, the Company consolidated former QSPEs that are
structured as CMBS and former QSPEs that are structured as collateralized debt obligations. At December 31, 2010, these entities held
total assets of $7,114 million, consisting of $201 million of FVO securities held by CSEs classified within trading and other securities,
$6,840 million of commercial mortgage loans, $34 million of accrued investment income and $39 million of cash. These entities had total
liabilities of $6,892 million, consisting of $6,820 million of long-term debt and $72 million of other liabilities. The assets of these entities
can only be used to settle their respective liabilities, and under no circumstances is the Company or any of its subsidiaries or affiliates
liable for any principal or interest shortfalls should any arise. The Company’s exposure is limited to that of its remaining investment in the
former QSPEs of $201 million at estimated fair value at December 31, 2010. The long-term debt referred to above bears interest at
primarily fixed rates ranging from 2.25% to 5.57%, payable primarily on a monthly basis and is expected to be repaid over the next 7 years.
Interest expense related to these obligations, included in other expenses, was $411 million for the year ended December 31, 2010.
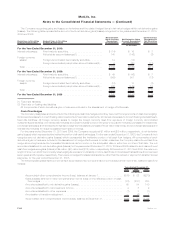
(2) See Note 12 for a description of the MetLife Reinsurance Company of South Carolina (“MRSC”) collateral financing arrangement. These
assets consist of the following, at estimated fair value at:
F-57MetLife, Inc.
MetLife, Inc.
Notes to the Consolidated Financial Statements — (Continued)