MetLife 2010 Annual Report Download - page 148
Download and view the complete annual report
Please find page 148 of the 2010 MetLife annual report below. You can navigate through the pages in the report by either clicking on the pages listed below, or by using the keyword search tool below to find specific information within the annual report.-
 1
1 -
2
-
3
-
4
-
5
-
6
-
7
-
8
-
9
-
10
-
11
-
12
-
13
-
14
-
15
-
16
-
17
-
18
-
19
-
20
-
21
-
22
-
23
-
24
-
25
-
26
-
27
-
28
-
29
-
30
-
31
-
32
-
33
-
34
-
35
-
36
-
37
-
38
-
39
-
40
-
41
-
42
-
43
-
44
-
45
-
46
-
47
-
48
-
49
-
50
-
51
-
52
-
53
-
54
-
55
-
56
-
57
-
58
-
59
-
60
-
61
-
62
-
63
-
64
-
65
-
66
-
67
-
68
-
69
-
70
-
71
-
72
-
73
-
74
-
75
-
76
-
77
-
78
-
79
-
80
-
81
-
82
-
83
-
84
-
85
-
86
-
87
-
88
-
89
-
90
-
91
-
92
-
93
-
94
-
95
-
96
-
97
-
98
-
99
-
100
-
101
-
102
-
103
-
104
-
105
-
106
-
107
-
108
-
109
-
110
-
111
-
112
-
113
-
114
-
115
-
116
-
117
-
118
-
119
-
120
-
121
-
122
-
123
-
124
-
125
-
126
-
127
-
128
-
129
-
130
-
131
-
132
-
133
-
134
-
135
-
136
-
137
-
 138
138 -
 139
139 -
 140
140 -
 141
141 -
 142
142 -
 143
143 -
 144
144 -
 145
145 -
 146
146 -
 147
147 -
 148
148 -
 149
149 -
 150
150 -
 151
151 -
 152
152 -
 153
153 -
 154
154 -
 155
155 -
 156
156 -
 157
157 -
 158
158 -
159
-
160
-
161
-
162
-
163
-
164
-
165
-
166
-
167
-
168
-
169
-
170
-
171
-
172
-
173
-
174
-
175
-
176
-
177
-
178
-
179
-
180
-
181
-
182
-
183
-
184
-
185
-
186
-
187
-
188
-
189
-
190
-
191
-
192
-
193
-
194
-
195
-
196
-
197
-
198
-
199
-
200
-
201
-
202
-
203
-
204
-
205
-
206
-
207
-
208
-
209
-
210
-
211
-
212
-
213
-
214
-
215
-
216
-
217
-
218
-
219
-
220
-
221
-
222
-
223
-
224
-
225
-
226
-
227
-
228
-
229
-
230
-
231
-
232
-
233
-
234
-
235
-
236
-
237
-
238
-
239
-
240
-
241
-
242
 |
 |

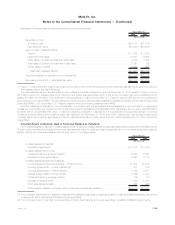
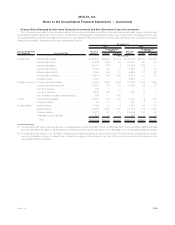
Primary Risks Managed by Derivative Financial Instruments and Non-Derivative Financial Instruments
The Company is exposed to various risks relating to its ongoing business operations, including interest rate risk, foreign currency risk,
credit risk and equity market risk. The Company uses a variety of strategies to manage these risks, including the use of derivative instruments.
The following table presents the gross notional amount, estimated fair value and primary underlying risk exposure of the Company’s derivative
financial instruments, excluding embedded derivatives, held at:
Primary Underlying
Risk Exposure Instrument Type Notional
Amount Assets Liabilities Notional
Amount Assets Liabilities
Estimated Fair
Value(1)
2010
Estimated Fair
Value(1)
2009
December 31,
(In millions)
Interest rate Interest rate swaps . . . . . . . . . . . . . . . . . . . $ 54,803 $2,654 $1,516 $ 38,152 $1,570 $1,255
Interest rate floors . . . . . . . . . . . . . . . . . . . 23,866 630 66 23,691 461 37
Interest rate caps . . . . . . . . . . . . . . . . . . . . 35,412 176 1 28,409 283 —
Interestratefutures .................. 9,385 43 17 7,563 8 10
Interest rate options . . . . . . . . . . . . . . . . . . 8,761 144 23 4,050 117 57
Interest rate forwards . . . . . . . . . . . . . . . . . 10,374 106 135 9,921 66 27
SyntheticGICs ..................... 4,397 — — 4,352 — —
Foreign currency Foreign currency swaps . . . . . . . . . . . . . . . 17,626 1,616 1,282 16,879 1,514 1,392
Foreign currency forwards . . . . . . . . . . . . . . 10,443 119 91 6,485 83 57
Currencyfutures .................... 493 2 — — — —
Currencyoptions.................... 5,426 50 — 822 18 —
Non-derivative hedging instruments(2) . . . . . . 169 — 185 — — —
Credit Credit default swaps . . . . . . . . . . . . . . . . . . 10,957 173 104 6,723 74 130
Creditforwards ..................... 90 2 3 220 2 6
Equitymarket Equityfutures ...................... 8,794 21 9 7,405 44 21
Equity options . . . . . . . . . . . . . . . . . . . . . . 33,688 1,843 1,197 27,175 1,712 1,018
Variance swaps . . . . . . . . . . . . . . . . . . . . . 18,022 198 118 13,654 181 58
Totalrateofreturnswaps .............. 1,547 — — 376 — 47
Total . . . . . . . . . . . . . . . . . . . . . . . . . . . $254,253 $7,777 $4,747 $195,877 $6,133 $4,115
(1) The estimated fair value of all derivatives in an asset position is reported within other invested assets in the consolidated balance sheets
and the estimated fair value of all derivatives in a liability position is reported within other liabilities in the consolidated balance sheets.
(2) The estimated fair value of non-derivative hedging instruments represents the amortized cost of the instruments, as adjusted for foreign
currency transaction gains or losses. Non-derivative hedging instruments are reported within policyholder account balances in the
consolidated balance sheets.
F-59MetLife, Inc.
MetLife, Inc.
Notes to the Consolidated Financial Statements — (Continued)