MetLife 2010 Annual Report Download - page 211
Download and view the complete annual report
Please find page 211 of the 2010 MetLife annual report below. You can navigate through the pages in the report by either clicking on the pages listed below, or by using the keyword search tool below to find specific information within the annual report.-
 1
1 -
2
-
3
-
4
-
5
-
6
-
7
-
8
-
9
-
10
-
11
-
12
-
13
-
14
-
15
-
16
-
17
-
18
-
19
-
20
-
21
-
22
-
23
-
24
-
25
-
26
-
27
-
28
-
29
-
30
-
31
-
32
-
33
-
34
-
35
-
36
-
37
-
38
-
39
-
40
-
41
-
42
-
43
-
44
-
45
-
46
-
47
-
48
-
49
-
50
-
51
-
52
-
53
-
54
-
55
-
56
-
57
-
58
-
59
-
60
-
61
-
62
-
63
-
64
-
65
-
66
-
67
-
68
-
69
-
70
-
71
-
72
-
73
-
74
-
75
-
76
-
77
-
78
-
79
-
80
-
81
-
82
-
83
-
84
-
85
-
86
-
87
-
88
-
89
-
90
-
91
-
92
-
93
-
94
-
95
-
96
-
97
-
98
-
99
-
100
-
101
-
102
-
103
-
104
-
105
-
106
-
107
-
108
-
109
-
110
-
111
-
112
-
113
-
114
-
115
-
116
-
117
-
118
-
119
-
120
-
121
-
122
-
123
-
124
-
125
-
126
-
127
-
128
-
129
-
130
-
131
-
132
-
133
-
134
-
135
-
136
-
137
-
138
-
139
-
140
-
141
-
142
-
143
-
144
-
145
-
146
-
147
-
148
-
149
-
150
-
151
-
152
-
153
-
154
-
155
-
156
-
157
-
158
-
159
-
160
-
161
-
162
-
163
-
164
-
165
-
166
-
167
-
168
-
169
-
170
-
171
-
172
-
173
-
174
-
175
-
176
-
177
-
178
-
179
-
180
-
181
-
182
-
183
-
184
-
185
-
186
-
187
-
188
-
189
-
190
-
191
-
192
-
193
-
194
-
195
-
196
-
197
-
198
-
199
-
200
-
 201
201 -
 202
202 -
 203
203 -
 204
204 -
 205
205 -
 206
206 -
 207
207 -
 208
208 -
 209
209 -
 210
210 -
 211
211 -
 212
212 -
 213
213 -
 214
214 -
 215
215 -
 216
216 -
 217
217 -
 218
218 -
 219
219 -
 220
220 -
 221
221 -
222
-
223
-
224
-
225
-
226
-
227
-
228
-
229
-
230
-
231
-
232
-
233
-
234
-
235
-
236
-
237
-
238
-
239
-
240
-
241
-
242
 |
 |

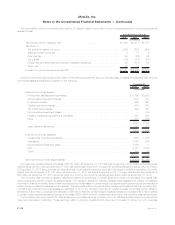
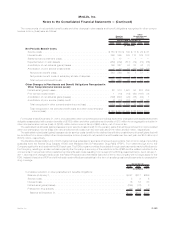
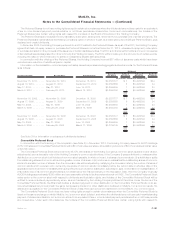
The aggregate pension accumulated benefit obligation and aggregate fair value of plan assets for pension benefit plans with accumulated
benefit obligations in excess of plan assets was as follows:
2010 2009
December 31,
(In millions)
Projectedbenefitobligations................................................. $1,436 $798
Accumulatedbenefitobligations .............................................. $1,307 $714
Fairvalueofplanassets.................................................... $ 106 $ 1
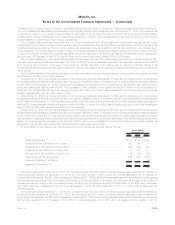
Information for pension and other postretirement benefit plans with a projected benefit obligation in excess of plan assets were as follows:
2010 2009 2010 2009
December 31,
Pension
Benefits
Other
Postretirement
Benefits
(In millions)
Projectedbenefitobligations.................................. $1,803 $6,580 $1,845 $1,847
Fairvalueofplanassets..................................... $ 461 $5,700 $1,200 $1,121
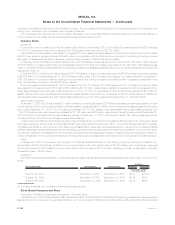
Net periodic pension costs and net periodic other postretirement benefit plan costs are comprised of the following:
i) Service Costs — Service costs are the increase in the projected (expected) pension benefit obligation resulting from benefits
payable to employees of the Subsidiaries on service rendered during the current year.
ii) Interest Costs on the Liability — Interest costs are the time value adjustment on the projected (expected) pension benefit
obligation at the end of each year.
iii) Settlement and Curtailment Costs — The aggregate amount of net gains (losses) recognized in net periodic benefit costs due to
settlements and curtailments. Settlements result from actions that relieve/eliminate the plan’s responsibility for benefit obligations
or risks associated with the obligations or assets used for the settlement. Curtailments result from an event that significantly
reduces/eliminates plan participants’ expected years of future services or benefit accruals.
iv) Expected Return on Plan Assets — Expected return on plan assets is the assumed return earned by the accumulated pension and
other postretirement fund assets in a particular year.
v) Amortization of Net Actuarial Gains (Losses) — Actuarial gains and losses result from differences between the actual experience
and the expected experience on pension and other postretirement plan assets or projected (expected) pension benefit obligation
during a particular period. These gains and losses are accumulated and, to the extent they exceed 10% of the greater of the PBO
or the fair value of plan assets, the excess is amortized into pension and other postretirement benefit costs over the expected
service years of the employees.
vi) Amortization of Prior Service Costs — These costs relate to the recognition of increases or decreases in pension and other
postretirement benefit obligation due to amendments in plans or initiation of new plans. These increases or decreases in obligation
are recognized in accumulated other comprehensive income (loss) at the time of the amendment. These costs are then amortized
to pension and other postretirement benefit costs over the expected service years of the employees affected by the change.
F-122 MetLife, Inc.
MetLife, Inc.
Notes to the Consolidated Financial Statements — (Continued)