MetLife 2010 Annual Report Download - page 127
Download and view the complete annual report
Please find page 127 of the 2010 MetLife annual report below. You can navigate through the pages in the report by either clicking on the pages listed below, or by using the keyword search tool below to find specific information within the annual report.-
 1
1 -
2
-
3
-
4
-
5
-
6
-
7
-
8
-
9
-
10
-
11
-
12
-
13
-
14
-
15
-
16
-
17
-
18
-
19
-
20
-
21
-
22
-
23
-
24
-
25
-
26
-
27
-
28
-
29
-
30
-
31
-
32
-
33
-
34
-
35
-
36
-
37
-
38
-
39
-
40
-
41
-
42
-
43
-
44
-
45
-
46
-
47
-
48
-
49
-
50
-
51
-
52
-
53
-
54
-
55
-
56
-
57
-
58
-
59
-
60
-
61
-
62
-
63
-
64
-
65
-
66
-
67
-
68
-
69
-
70
-
71
-
72
-
73
-
74
-
75
-
76
-
77
-
78
-
79
-
80
-
81
-
82
-
83
-
84
-
85
-
86
-
87
-
88
-
89
-
90
-
91
-
92
-
93
-
94
-
95
-
96
-
97
-
98
-
99
-
100
-
101
-
102
-
103
-
104
-
105
-
106
-
107
-
108
-
109
-
110
-
111
-
112
-
113
-
114
-
115
-
116
-
 117
117 -
 118
118 -
 119
119 -
 120
120 -
 121
121 -
 122
122 -
 123
123 -
 124
124 -
 125
125 -
 126
126 -
 127
127 -
 128
128 -
 129
129 -
 130
130 -
 131
131 -
 132
132 -
 133
133 -
 134
134 -
 135
135 -
 136
136 -
 137
137 -
138
-
139
-
140
-
141
-
142
-
143
-
144
-
145
-
146
-
147
-
148
-
149
-
150
-
151
-
152
-
153
-
154
-
155
-
156
-
157
-
158
-
159
-
160
-
161
-
162
-
163
-
164
-
165
-
166
-
167
-
168
-
169
-
170
-
171
-
172
-
173
-
174
-
175
-
176
-
177
-
178
-
179
-
180
-
181
-
182
-
183
-
184
-
185
-
186
-
187
-
188
-
189
-
190
-
191
-
192
-
193
-
194
-
195
-
196
-
197
-
198
-
199
-
200
-
201
-
202
-
203
-
204
-
205
-
206
-
207
-
208
-
209
-
210
-
211
-
212
-
213
-
214
-
215
-
216
-
217
-
218
-
219
-
220
-
221
-
222
-
223
-
224
-
225
-
226
-
227
-
228
-
229
-
230
-
231
-
232
-
233
-
234
-
235
-
236
-
237
-
238
-
239
-
240
-
241
-
242
 |
 |

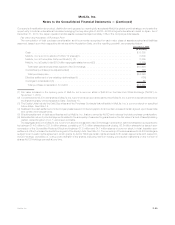
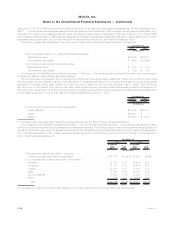
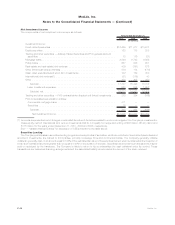
(1) All of the Company’s Alt-A RMBS holdings in the 2009 and 2010 vintage years are Re-REMIC Alt-A RMBS that were purchased in 2009
and 2010 and are comprised of original issue vintage year 2005 through 2007 Alt-A RMBS. All of the Company’s Re-REMIC Alt-A RMBS
holdings are NAIC 1 rated.
Amount %of
Total Amount %of
Total
2010 2009
December 31,
(In millions)
Netunrealizedgain(loss)...................................... $(670) $(1,248)
RatedAa/AAorbetter........................................ 15.9% 26.3%
RatedNAIC1 ............................................. 39.5% 31.3%
Distribution of holdings — at estimated fair value — by collateral type:
Fixedratemortgageloanscollateral ............................. 90.7% 89.3%
Hybridadjustableratemortgageloanscollateral ..................... 9.3 10.7
Total Alt-A RMBS . . . . . . . . . . . . . . . . . . . . . . . . . . . . . . . . . . . . . . . . 100.0% 100.0%
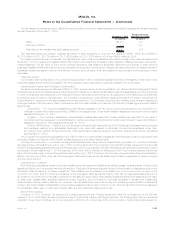
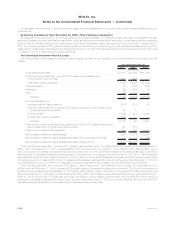
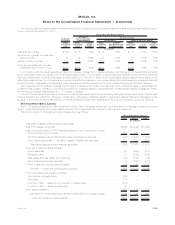
Concentrations of Credit Risk (Fixed Maturity Securities) — CMBS. The Company’s holdings in CMBS were $20.7 billion and $15.6 bil-
lion at estimated fair value at December 31, 2010 and 2009, respectively. The Company had no exposure to CMBS index securities at
December 31, 2010 or 2009. The Company held commercial real estate collateralized debt obligations securities of $138 million and
$111 million at estimated fair value at December 31, 2010 and 2009, respectively.
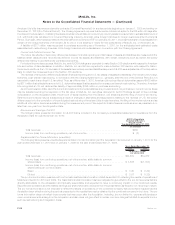
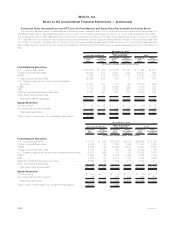
The following tables present the Company’s holdings of CMBS by rating agency designation and by vintage year at:
Amortized
Cost
Estimated
Fair
Value Amortized
Cost
Estimated
Fair
Value Amortized
Cost
Estimated
Fair
Value Amortized
Cost
Estimated
Fair
Value Amortized
Cost
Estimated
Fair
Value Amortized
Cost
Estimated
Fair
Value
Aaa Aa A Baa
Below
Investment
Grade Total
December 31, 2010
(In millions)
2003 & Prior . . . . . . . . . . . $ 7,411 $ 7,640 $ 282 $ 282 $228 $227 $ 74 $ 71 $ 28 $ 24 $ 8,023 $ 8,244
2004................ 3,489 3,620 277 273 216 209 181 175 91 68 4,254 4,345
2005................ 3,113 3,292 322 324 286 280 263 255 73 66 4,057 4,217
2006................ 1,463 1,545 159 160 168 168 385 398 166 156 2,341 2,427
2007................ 840 791 344 298 96 95 119 108 122 133 1,521 1,425
2008................ 2 2 — — — — — — — — 2 2
2009................ 3 3 — — — — — — — — 3 3
2010................ 8 8 — — 4 4 — — — — 12 12
Total............... $16,329 $16,901 $1,384 $1,337 $998 $983 $1,022 $1,007 $480 $447 $20,213 $20,675
Ratings Distribution . . . . . . . 81.7% 6.4% 4.8% 4.9% 2.2% 100.0%
The December 31, 2010 table reflects rating agency designations assigned by nationally recognized rating agencies including Moody’s,
S&P, Fitch and Realpoint, LLC.
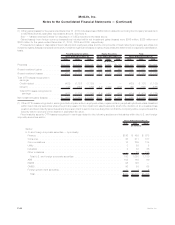
Amortized
Cost
Estimated
Fair
Value Amortized
Cost
Estimated
Fair
Value Amortized
Cost
Estimated
Fair
Value Amortized
Cost
Estimated
Fair
Value Amortized
Cost
Estimated
Fair
Value Amortized
Cost
Estimated
Fair
Value
Aaa Aa A Baa
Below
Investment
Grade Total
December 31, 2009
(In millions)
2003 & Prior . . . . . . . . . . . $ 6,836 $ 6,918 $394 $365 $ 162 $140 $ 52 $ 41 $ 36 $ 18 $ 7,480 $ 7,482
2004................ 2,240 2,255 200 166 114 71 133 87 88 58 2,775 2,637
2005................ 2,956 2,853 144 108 85 65 39 24 57 51 3,281 3,101
2006................ 1,087 1,009 162 139 380 323 187 129 123 48 1,939 1,648
2007................ 432 314 13 12 361 257 234 153 35 13 1,075 749
2008................ 5 5 — — — — — — — — 5 5
2009................ — — — — — — — — — — — —
Total............... $13,556 $13,354 $913 $790 $1,102 $856 $645 $434 $339 $188 $16,555 $15,622
Ratings Distribution . . . . . . . 85.4% 5.1% 5.5% 2.8% 1.2% 100.0%
F-38 MetLife, Inc.
MetLife, Inc.
Notes to the Consolidated Financial Statements — (Continued)