MetLife 2010 Annual Report Download - page 85
Download and view the complete annual report
Please find page 85 of the 2010 MetLife annual report below. You can navigate through the pages in the report by either clicking on the pages listed below, or by using the keyword search tool below to find specific information within the annual report.-
 1
1 -
2
-
3
-
4
-
5
-
6
-
7
-
8
-
9
-
10
-
11
-
12
-
13
-
14
-
15
-
16
-
17
-
18
-
19
-
20
-
21
-
22
-
23
-
24
-
25
-
26
-
27
-
28
-
29
-
30
-
31
-
32
-
33
-
34
-
35
-
36
-
37
-
38
-
39
-
40
-
41
-
42
-
43
-
44
-
45
-
46
-
47
-
48
-
49
-
50
-
51
-
52
-
53
-
54
-
55
-
56
-
57
-
58
-
59
-
60
-
61
-
62
-
63
-
64
-
65
-
66
-
67
-
68
-
69
-
70
-
71
-
72
-
73
-
74
-
 75
75 -
 76
76 -
 77
77 -
 78
78 -
 79
79 -
 80
80 -
 81
81 -
 82
82 -
 83
83 -
 84
84 -
 85
85 -
 86
86 -
 87
87 -
 88
88 -
 89
89 -
 90
90 -
 91
91 -
 92
92 -
 93
93 -
 94
94 -
 95
95 -
96
-
97
-
98
-
99
-
100
-
101
-
102
-
103
-
104
-
105
-
106
-
107
-
108
-
109
-
110
-
111
-
112
-
113
-
114
-
115
-
116
-
117
-
118
-
119
-
120
-
121
-
122
-
123
-
124
-
125
-
126
-
127
-
128
-
129
-
130
-
131
-
132
-
133
-
134
-
135
-
136
-
137
-
138
-
139
-
140
-
141
-
142
-
143
-
144
-
145
-
146
-
147
-
148
-
149
-
150
-
151
-
152
-
153
-
154
-
155
-
156
-
157
-
158
-
159
-
160
-
161
-
162
-
163
-
164
-
165
-
166
-
167
-
168
-
169
-
170
-
171
-
172
-
173
-
174
-
175
-
176
-
177
-
178
-
179
-
180
-
181
-
182
-
183
-
184
-
185
-
186
-
187
-
188
-
189
-
190
-
191
-
192
-
193
-
194
-
195
-
196
-
197
-
198
-
199
-
200
-
201
-
202
-
203
-
204
-
205
-
206
-
207
-
208
-
209
-
210
-
211
-
212
-
213
-
214
-
215
-
216
-
217
-
218
-
219
-
220
-
221
-
222
-
223
-
224
-
225
-
226
-
227
-
228
-
229
-
230
-
231
-
232
-
233
-
234
-
235
-
236
-
237
-
238
-
239
-
240
-
241
-
242
 |
 |

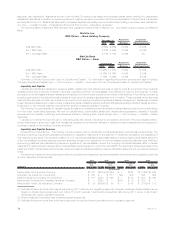
by $478 million or 54% at December 31, 2010 from December 31, 2009. This change was due to an increase in exchange rate risk relating to
fixed maturity securities of $722 million due to higher exposures primarily within the British pound and the Euro and to the sale of the pension
closeout business in the U.K. Additionally, a decrease in the foreign exposure related to long-term debt and PABs contributed $66 million and
$41 million, respectively, to the increase. This was partially offset by an increase in the foreign exposure related to net embedded derivatives
within liability host contracts and the use of derivatives employed by the Company of $315 million and $101 million, respectively. The
remainder of the fluctuation is attributable to numerous immaterial items.
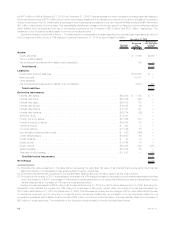
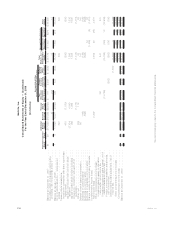
Sensitivity Analysis: Equity Market Prices. The table below provides additional detail regarding the potential loss in estimated fair value of
the Company’s portfolio due to a 10% change in equity at December 31, 2010 by type of asset or liability:
Notional
Amount
Estimated
Fair
Value(1)
Assuming a
10% Decrease
in Equity
Prices
December 31, 2010
(In millions)
Assets:
Equity securities . . . . . . . . . . . . . . . . . . . . . . . . . . . . . . . . . . . . . . . . . . . . . . . . . . . . $ 3,606 $(355)
Other invested assets:
Netembeddedderivativeswithinassethostcontracts(2) ......................... 185 11
Total Assets . . . . . . . . . . . . . . . . . . . . . . . . . . . . . . . . . . . . . . . . . . . . . . . . . . . . $(344)
Liabilities:
Policyholderaccountbalances .......................................... $152,850 $ —
Bankdeposits..................................................... 10,371 —
Other liabilities:
Netembeddedderivativeswithinliabilityhostcontracts(2)......................... 2,634 (456)
Total Liabilities . . . . . . . . . . . . . . . . . . . . . . . . . . . . . . . . . . . . . . . . . . . . . . . . . . $(456)
Derivative Instruments:
Interestrateswaps.................................................. $54,803 $ 1,138 $ —
Interestratefloors .................................................. $23,866 564 —
Interestratecaps................................................... $35,412 175 —
Interestratefutures.................................................. $ 9,385 26 —
Interestrateoptions ................................................. $ 8,761 121 —
Interestrateforwards ................................................ $10,374 (29) —
SyntheticGICs..................................................... $ 4,397 — —
Foreigncurrencyswaps............................................... $17,626 334 —
Foreigncurrencyforwards ............................................. $10,443 28 —
Currencyfutures ................................................... $ 493 2 —
Currencyoptions ................................................... $ 5,426 50 —
Non-derivativehedginginstruments ....................................... $ 169 (185) —
Creditdefaultswaps................................................. $10,957 69 —
Creditforwards .................................................... $ 90 (1) —
Equityfutures ..................................................... $ 8,794 12 3
Equityoptions..................................................... $33,688 646 628
Varianceswaps .................................................... $18,022 80 —
Totalrateofreturnswaps.............................................. $ 1,547 — 155
Total Derivative Instruments ........................................ $786
Net Change ....................................................... $ (14)
(1) Estimated fair value presented in the table above represents the estimated fair value of all financial instruments within this financial
statement caption not necessarily those solely subject to equity market risk.
(2) Embedded derivatives are recognized in the consolidated balance sheet in the same caption as the host contract.
(3) During the fourth quarter of 2010, the analysis of the impact of a 10% change (increase or decrease) in equity market rates determined that
due to the inclusion of ALICO, a decrease of 10% had the most adverse effect on our equity risk while the prior year end’s analysis of equity
market rates shows an increase of 10% had the most adverse effect.
Equity price risk decreased by $204 million to $14 million at December 31, 2010 from $218 million at December 31, 2009. Excluding the
Acquisition which shifted the impact of a 10% change to a decrease in the equity market rates, the equity price risk has decreased by
$191 million at December 31, 2010 from December 31, 2009. This decrease is primarily due to a change of $210 million attributed to the use
of derivatives employed by the Company to hedge its equity exposures. Additionally, an increase in the net exposures related to net
embedded derivatives within liability host contracts of $42 million contributed to the decrease. This was partially offset by a decrease of
$60 million in equity securities. The remainder of the fluctuation is attributable to numerous insignificant items.
82 MetLife, Inc.