MetLife 2010 Annual Report Download - page 27
Download and view the complete annual report
Please find page 27 of the 2010 MetLife annual report below. You can navigate through the pages in the report by either clicking on the pages listed below, or by using the keyword search tool below to find specific information within the annual report.-
 1
1 -
2
-
3
-
4
-
5
-
6
-
7
-
8
-
9
-
10
-
11
-
12
-
13
-
14
-
15
-
16
-
 17
17 -
 18
18 -
 19
19 -
 20
20 -
 21
21 -
 22
22 -
 23
23 -
 24
24 -
 25
25 -
 26
26 -
 27
27 -
 28
28 -
 29
29 -
 30
30 -
 31
31 -
 32
32 -
 33
33 -
 34
34 -
 35
35 -
 36
36 -
 37
37 -
38
-
39
-
40
-
41
-
42
-
43
-
44
-
45
-
46
-
47
-
48
-
49
-
50
-
51
-
52
-
53
-
54
-
55
-
56
-
57
-
58
-
59
-
60
-
61
-
62
-
63
-
64
-
65
-
66
-
67
-
68
-
69
-
70
-
71
-
72
-
73
-
74
-
75
-
76
-
77
-
78
-
79
-
80
-
81
-
82
-
83
-
84
-
85
-
86
-
87
-
88
-
89
-
90
-
91
-
92
-
93
-
94
-
95
-
96
-
97
-
98
-
99
-
100
-
101
-
102
-
103
-
104
-
105
-
106
-
107
-
108
-
109
-
110
-
111
-
112
-
113
-
114
-
115
-
116
-
117
-
118
-
119
-
120
-
121
-
122
-
123
-
124
-
125
-
126
-
127
-
128
-
129
-
130
-
131
-
132
-
133
-
134
-
135
-
136
-
137
-
138
-
139
-
140
-
141
-
142
-
143
-
144
-
145
-
146
-
147
-
148
-
149
-
150
-
151
-
152
-
153
-
154
-
155
-
156
-
157
-
158
-
159
-
160
-
161
-
162
-
163
-
164
-
165
-
166
-
167
-
168
-
169
-
170
-
171
-
172
-
173
-
174
-
175
-
176
-
177
-
178
-
179
-
180
-
181
-
182
-
183
-
184
-
185
-
186
-
187
-
188
-
189
-
190
-
191
-
192
-
193
-
194
-
195
-
196
-
197
-
198
-
199
-
200
-
201
-
202
-
203
-
204
-
205
-
206
-
207
-
208
-
209
-
210
-
211
-
212
-
213
-
214
-
215
-
216
-
217
-
218
-
219
-
220
-
221
-
222
-
223
-
224
-
225
-
226
-
227
-
228
-
229
-
230
-
231
-
232
-
233
-
234
-
235
-
236
-
237
-
238
-
239
-
240
-
241
-
242
 |
 |

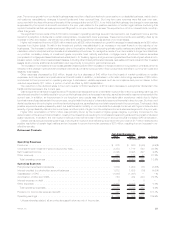
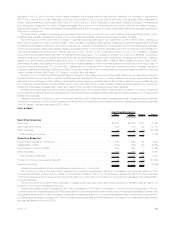
During 2010, overall annuity sales decreased 5% compared to 2009 as declines in fixed annuity sales were partially offset by increased
sales of our variable annuity products. The financial market turmoil in early 2009 resulted in extraordinarily high sales of fixed annuity products
in 2009. The high sales level was not expected to continue after the financial markets returned to more stable levels. Variable annuity product
sales increased primarily due to the expansion of alternative distribution channels and fewer competitors in the market place. Surrender rates
for both our variable and fixed annuities remained low during the current period as we believe our customers continue to value our products
compared to other alternatives in the marketplace.
Interest rate and equity market changes were the primary driver of the $431 million increase in operating earnings, with the largest impact
resulting from a $370 million increase in policy fees and other revenues, a $193 million increase in net investment income, and a $59 million
decrease in variable annuity guarantee benefit costs, offset by a $204 million increase in DAC, VOBA and DSI amortization and a $39 million
increase in commission expense resulting from growth in annuity contract balances.
A significant increase in average separate account balances was largely attributable to favorable market performance resulting from
improved market conditions since the second quarter of 2009 and positive net cash flows from the annuity business. This resulted in higher
policy fees and other revenues of $370 million, partially offset by greater DAC, VOBA and DSI amortization. Policy fees are typically calculated
as a percentage of the average assets in the separate account. DAC, VOBA and DSI amortization is based on the earnings of the business,
which in the retirement business are derived, in part, from fees earned on separate account balances.
Financial market improvements also resulted in the increase in net investment income of $193 million as a $291 million increase from
higher yields was partially offset by a $98 million decrease from a decline in average invested assets. Yields were positively impacted by the
effects of the continued repositioning of the accumulated liquidity in our investment portfolio to longer duration and higher yielding assets,
including investment grade corporate fixed maturity securities. Yields were also positively impacted by the effects of recovering private equity
markets and stabilizing real estate markets on other limited partnership interests and real estate joint ventures. Despite positive net cash
flows, a reduction in the general account investment portfolio was due to the impact of more customers gaining confidence in the equity
markets and, as a result, electing to transfer funds into our separate account investment options as market conditions improved. To manage
the needs of our intermediate to longer-term liabilities, our investment portfolio consists primarily of investment grade corporate fixed maturity
securities, structured finance securities, mortgage loans and U.S. Treasury, agency and government guaranteed fixed maturity securities
and, to a lesser extent, certain other invested asset classes, including other limited partnership interests, real estate joint ventures and other
invested assets, in order to provide additional diversification and opportunity for long-term yield enhancement.
There was a $59 million decrease in variable annuity guaranteed benefit costs in 2010 compared to 2009. Costs associated with our
annuity guaranteed benefit liabilities, hedge programs and reinsurance programs are impacted by equity markets and interest rate levels to
varying degrees. While the equity market improved in both 2010 and 2009, the improvement in 2009 was greater. Interest rate levels declined
in the current year and increased in the prior year. Annuity guaranteed benefit liabilities, net of a decrease in paid claims, increased benefits by
$93 million primarily from our annual unlocking of assumptions related to these liabilities. The hedge and reinsurance programs which are
used to mitigate the risk associated with these guarantees produced losses in both periods, but the losses in the prior period were more
significant due to the 2009 equity market recovery. The costs related to our hedge and reinsurance programs decreased by $152 million in
2010 compared to 2009. These hedge and reinsurance programs, which are a key part of our risk management strategy, performed as
anticipated.
Interest credited expense decreased $49 million driven by lower average crediting rates on fixed annuities and higher amortization of
excess interest reserve due to one large case surrender in 2010, partially offset by growth in our fixed annuity policyholder account balances.
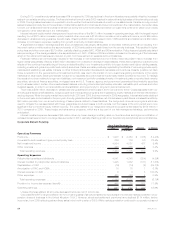
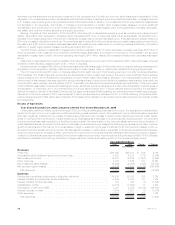
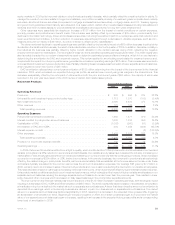
Corporate Benefit Funding
2010 2009 Change % Change
Years Ended December 31,
(In millions)
Operating Revenues
Premiums.................................................. $ 1,938 $ 2,264 $ (326) (14.4)%
Universallifeandinvestment-typeproductpolicyfees..................... 226 176 50 28.4%
Netinvestmentincome......................................... 4,954 4,527 427 9.4%
Otherrevenues.............................................. 246 238 8 3.4%
Totaloperatingrevenues....................................... 7,364 7,205 159 2.2%
Operating Expenses
Policyholderbenefitsanddividends................................. 4,041 4,245 (204) (4.8)%
Interestcreditedtopolicyholderaccountbalances ....................... 1,445 1,632 (187) (11.5)%
CapitalizationofDAC .......................................... (19) (14) (5) (35.7)%
AmortizationofDACandVOBA.................................... 16 15 1 6.7%
Interest expense on debt . . . . . . . . . . . . . . . . . . . . . . . . . . . . . . . . . . . . . . . . 6 3 3 100.0%
Otherexpenses.............................................. 460 456 4 0.9%
Totaloperatingexpenses ...................................... 5,949 6,337 (388) (6.1)%
Provisionforincometaxexpense(benefit)............................. 495 288 207 71.9%
Operatingearnings............................................ $ 920 $ 580 $ 340 58.6%
Unless otherwise stated, all amounts discussed below are net of income tax.
Corporate Benefit Funding benefited in 2010 from strong sales of structured settlement products and continued market penetration of our
pension closeout business in the United Kingdom (“U.K.”) However, structured settlement premiums have declined $174 million, before
income tax, from 2009 reflecting extraordinary sales in the fourth quarter of 2009. While market penetration continued in our pension closeout
24 MetLife, Inc.