MetLife 2010 Annual Report Download - page 231
Download and view the complete annual report
Please find page 231 of the 2010 MetLife annual report below. You can navigate through the pages in the report by either clicking on the pages listed below, or by using the keyword search tool below to find specific information within the annual report.-
 1
1 -
2
-
3
-
4
-
5
-
6
-
7
-
8
-
9
-
10
-
11
-
12
-
13
-
14
-
15
-
16
-
17
-
18
-
19
-
20
-
21
-
22
-
23
-
24
-
25
-
26
-
27
-
28
-
29
-
30
-
31
-
32
-
33
-
34
-
35
-
36
-
37
-
38
-
39
-
40
-
41
-
42
-
43
-
44
-
45
-
46
-
47
-
48
-
49
-
50
-
51
-
52
-
53
-
54
-
55
-
56
-
57
-
58
-
59
-
60
-
61
-
62
-
63
-
64
-
65
-
66
-
67
-
68
-
69
-
70
-
71
-
72
-
73
-
74
-
75
-
76
-
77
-
78
-
79
-
80
-
81
-
82
-
83
-
84
-
85
-
86
-
87
-
88
-
89
-
90
-
91
-
92
-
93
-
94
-
95
-
96
-
97
-
98
-
99
-
100
-
101
-
102
-
103
-
104
-
105
-
106
-
107
-
108
-
109
-
110
-
111
-
112
-
113
-
114
-
115
-
116
-
117
-
118
-
119
-
120
-
121
-
122
-
123
-
124
-
125
-
126
-
127
-
128
-
129
-
130
-
131
-
132
-
133
-
134
-
135
-
136
-
137
-
138
-
139
-
140
-
141
-
142
-
143
-
144
-
145
-
146
-
147
-
148
-
149
-
150
-
151
-
152
-
153
-
154
-
155
-
156
-
157
-
158
-
159
-
160
-
161
-
162
-
163
-
164
-
165
-
166
-
167
-
168
-
169
-
170
-
171
-
172
-
173
-
174
-
175
-
176
-
177
-
178
-
179
-
180
-
181
-
182
-
183
-
184
-
185
-
186
-
187
-
188
-
189
-
190
-
191
-
192
-
193
-
194
-
195
-
196
-
197
-
198
-
199
-
200
-
201
-
202
-
203
-
204
-
205
-
206
-
207
-
208
-
209
-
210
-
211
-
212
-
213
-
214
-
215
-
216
-
217
-
218
-
219
-
220
-
 221
221 -
 222
222 -
 223
223 -
 224
224 -
 225
225 -
 226
226 -
 227
227 -
 228
228 -
 229
229 -
 230
230 -
 231
231 -
 232
232 -
 233
233 -
 234
234 -
 235
235 -
 236
236 -
 237
237 -
 238
238 -
 239
239 -
 240
240 -
 241
241 -
242
 |
 |
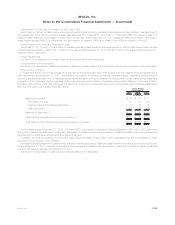
Life insurance products and services include variable life, universal life and term life products. Individual Life insurance products and services
include variable life, universal life, term life and whole life products. Non-Medical Health products and services include dental insurance,
short- and long-term disability, long-term care and other insurance products. Retirement Products offers asset accumulation and income
products, including a wide variety of annuities. Corporate Benefit Funding offers pension risk solutions, structured settlements, stable value
and investment products and other benefit funding products. Auto & Home provides personal lines property and casualty insurance,
including private passenger automobile, homeowners and personal excess liability insurance. In the fourth quarter of 2010, management
realigned certain income annuity products within the Company’s segments to better conform to the way it manages and assesses its
business and began reporting such product results in the Retirement Products segment, previously reported in the Corporate Benefit
Funding segment. Accordingly, prior period results for these segments have been adjusted by $29 million and $13 million of operating losses,
net of $15 million and $8 million of income tax benefits, for the years ended December 31, 2009 and 2008, respectively, to reflect such
product reclassifications.
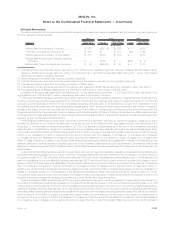
International provides life insurance, accident and health insurance, credit insurance, annuities, endowments and retirement & savings
products to both individuals and groups.
Banking, Corporate & Other contains the excess capital not allocated to the segments, the results of operations of MetLife Bank, various
start-up entities and run-off entities, as well as interest expense related to the majority of the Company’s outstanding debt and expenses
associated with certain legal proceedings and income tax audit issues. Banking, Corporate & Other also includes the elimination of
intersegment amounts, which generally relate to intersegment loans, which bear interest rates commensurate with related borrowings.
Operating earnings is the measure of segment profit or loss the Company uses to evaluate segment performance and allocate resources.
Consistent with GAAP accounting guidance for segment reporting, it is the Company’s measure of segment performance reported below.
Operating earnings does not equate to income (loss) from continuing operations, net of income tax or net income (loss) as determined in
accordance with GAAP and should not be viewed as a substitute for those GAAP measures. The Company believes the presentation of
operating earnings herein as the Company measures it for management purposes enhances the understanding of its performance by
highlighting the results from operations and the underlying profitability drivers of the businesses.
Operating earnings is defined as operating revenues less operating expenses, net of income tax.
Operating revenues is defined as GAAP revenues (i) less net investment gains (losses) and net derivative gains (losses); (ii) less
amortization of unearned revenue related to net investment gains (losses) and net derivative gains (losses); (iii) plus scheduled periodic
settlement payments on derivatives that are hedges of investments but do not qualify for hedge accounting treatment; (iv) plus income from
discontinued real estate operations; (v) less net investment income related to contractholder-directed unit-linked investments; and (vi) plus,
for operating joint ventures reported under the equity method of accounting, the aforementioned adjustments, those identified in the
definition of operating expenses and changes in fair value of hedges of operating joint venture liabilities, all net of income tax.
Operating expenses is defined as GAAP expenses (i) less changes in policyholder benefits associated with asset value fluctuations
related to experience-rated contractholder liabilities and certain inflation-indexed liabilities; (ii) less costs related to business combinations
(since January 1, 2009) and noncontrolling interests; (iii) less amortization of DAC and VOBA and changes in the policyholder dividend
obligation related to net investment gains (losses) and net derivative gains (losses); (iv) less interest credited to policyholder account
balances related to contractholder-directed unit-linked investments; and (v) plus scheduled periodic settlement payments on derivatives that
are hedges of policyholder account balances but do not qualify for hedge accounting treatment.
In addition, operating revenues and operating expenses do not reflect the consolidation of certain securitization entities that are VIEs as
required under GAAP.
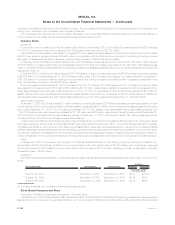
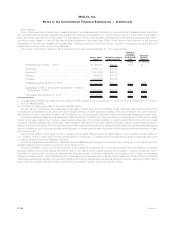
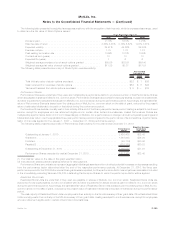
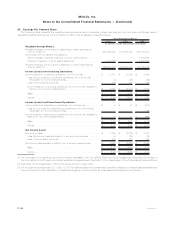
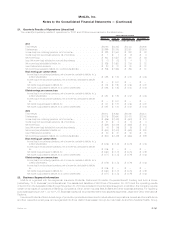
Set forth in the tables below is certain financial information with respect to the Company’s segments, as well as Banking, Corporate &
Other for the years ended December 31, 2010, 2009 and 2008 and at December 31, 2010 and 2009. The accounting policies of the
segments are the same as those of the Company, except for the method of capital allocation and the accounting for gains (losses) from
intercompany sales, which are eliminated in consolidation. Economic capital is an internally developed risk capital model, the purpose of
which is to measure the risk in the business and to provide a basis upon which capital is deployed. The economic capital model accounts for
the unique and specific nature of the risks inherent in the Company’s businesses. As a part of the economic capital process, a portion of net
investment income is credited to the segments based on the level of allocated equity. The Company allocates certain non-recurring items,
such as expenses associated with certain legal proceedings, to Banking, Corporate & Other.
F-142 MetLife, Inc.
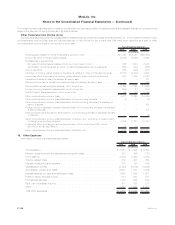
MetLife, Inc.
Notes to the Consolidated Financial Statements — (Continued)