MetLife 2010 Annual Report Download - page 57
Download and view the complete annual report
Please find page 57 of the 2010 MetLife annual report below. You can navigate through the pages in the report by either clicking on the pages listed below, or by using the keyword search tool below to find specific information within the annual report.-
 1
1 -
2
-
3
-
4
-
5
-
6
-
7
-
8
-
9
-
10
-
11
-
12
-
13
-
14
-
15
-
16
-
17
-
18
-
19
-
20
-
21
-
22
-
23
-
24
-
25
-
26
-
27
-
28
-
29
-
30
-
31
-
32
-
33
-
34
-
35
-
36
-
37
-
38
-
39
-
40
-
41
-
42
-
43
-
44
-
45
-
46
-
 47
47 -
 48
48 -
 49
49 -
 50
50 -
 51
51 -
 52
52 -
 53
53 -
 54
54 -
 55
55 -
 56
56 -
 57
57 -
 58
58 -
 59
59 -
 60
60 -
 61
61 -
 62
62 -
 63
63 -
 64
64 -
 65
65 -
 66
66 -
 67
67 -
68
-
69
-
70
-
71
-
72
-
73
-
74
-
75
-
76
-
77
-
78
-
79
-
80
-
81
-
82
-
83
-
84
-
85
-
86
-
87
-
88
-
89
-
90
-
91
-
92
-
93
-
94
-
95
-
96
-
97
-
98
-
99
-
100
-
101
-
102
-
103
-
104
-
105
-
106
-
107
-
108
-
109
-
110
-
111
-
112
-
113
-
114
-
115
-
116
-
117
-
118
-
119
-
120
-
121
-
122
-
123
-
124
-
125
-
126
-
127
-
128
-
129
-
130
-
131
-
132
-
133
-
134
-
135
-
136
-
137
-
138
-
139
-
140
-
141
-
142
-
143
-
144
-
145
-
146
-
147
-
148
-
149
-
150
-
151
-
152
-
153
-
154
-
155
-
156
-
157
-
158
-
159
-
160
-
161
-
162
-
163
-
164
-
165
-
166
-
167
-
168
-
169
-
170
-
171
-
172
-
173
-
174
-
175
-
176
-
177
-
178
-
179
-
180
-
181
-
182
-
183
-
184
-
185
-
186
-
187
-
188
-
189
-
190
-
191
-
192
-
193
-
194
-
195
-
196
-
197
-
198
-
199
-
200
-
201
-
202
-
203
-
204
-
205
-
206
-
207
-
208
-
209
-
210
-
211
-
212
-
213
-
214
-
215
-
216
-
217
-
218
-
219
-
220
-
221
-
222
-
223
-
224
-
225
-
226
-
227
-
228
-
229
-
230
-
231
-
232
-
233
-
234
-
235
-
236
-
237
-
238
-
239
-
240
-
241
-
242
 |
 |
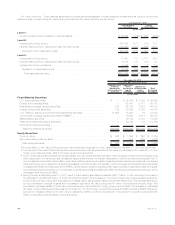
Mortgage Loan Credit Quality — Monitoring Process — Commercial and Agricultural Mortgage Loans. The Company reviews all
commercial mortgage loans on an ongoing basis. These reviews may include an analysis of the property financial statements and rent
roll, lease rollover analysis, property inspections, market analysis, estimated valuations of the underlying collateral, loan-to-value ratios, debt
service coverage ratios, and tenant creditworthiness. The monitoring process focuses on higher risk loans, which include those that are
classified as restructured, potentially delinquent, delinquent or in foreclosure, as well as loans with higher loan-to-value ratios and lower debt
servicecoverageratios.Themonitoringprocessforagriculturalmortgage loans is generally similar, with a focus on higher risk loans, such as
loans with higher loan-to-value ratios, including reviews on a geographic and property type basis.
Loan-to-value ratios and debt service coverage ratios are common measures in the assessment of the quality of commercial mortgage
loans. Loan-to-value ratios are a common measure in the assessment of the quality of agricultural mortgage loans. Loan-to-value ratios
compare the amount of the loan to the estimated fair value of the underlying collateral. A loan-to-value ratio greater than 100% indicates that
the loan amount is greater than the collateral value. A loan-to-value ratio of less than 100% indicates an excess of collateral value over the loan
amount. The debt service coverage ratio compares a property’s net operating income to amounts needed to service the principal and interest
due under the loan. For commercial mortgage loans, the average loan-to-value ratio was 66% and 68% at December 31, 2010 and 2009,
respectively, and the average debt service coverage ratio was 2.4x, as compared to 2.2x at December 31, 2009. For agricultural mortgage
loans, the average loan-to-value ratio was 49% at both December 31, 2010 and 2009, respectively. The values utilized in calculating these
ratios are developed in connection with our review of the commercial and agricultural mortgage loans, and are updated routinely, including a
periodic quality rating process and an evaluation of the estimated fair value of the underlying collateral.
Mortgage Loan Credit Quality — Monitoring Process — Residential Mortgage Loans. The Company has a conservative residential
mortgage loan portfolio and does not hold any option ARMs, sub-prime or low teaser rate. Higher risk loans include those that are classified as
restructured, potentially delinquent, delinquent or in foreclosure, as well as loans with higher loan-to-value ratios and interest-only loans. The
Company’s investment in residential junior lien loans and residential mortgage loans with a loan-to-value ratio of 80% or more was $95 million
and $76 million at December 31, 2010 and 2009, respectively, and the majority of the higher loan-to-value residential mortgage loans have
mortgage insurance coverage which reduces the loan-to-value ratio to less than 80%. Additionally, the Company’s investment in traditional
residential interest-only mortgage loans was $389 million and $323 million at December 31, 2010 and 2009, respectively.
Mortgage Loan Valuation Allowances. The Company’s valuation allowances are established both on a loan specific basis for those loans
considered impaired where a property specific or market specific risk has been identified that could likely result in a future loss, as well as for
pools of loans with similar risk characteristics where a property specific or market specific risk has not been identified, but for which the
Company expects to incur a loss. Accordingly, a valuation allowance is provided to absorb these estimated probable credit losses. The
Company records additions to and decreases in its valuation allowances and gains and losses from the sale of loans in net investment gains
(losses).
The Company records valuation allowances for loans considered to be impaired when it is probable that, based upon current information
and events, the Company will be unable to collect all amounts due under the contractual terms of the loan agreement. Based on the facts and
circumstances of the individual loans being impaired, loan specific valuation allowances are established for the excess carrying value of the
loan over either: (i) the present value of expected future cash flows discounted at the loan’s original effective interest rate; (ii) the estimated fair
value of the loan’s underlying collateral if the loan is in the process of foreclosure or otherwise collateral dependent; or (iii) the loan’s
observable market price.
The Company also establishes valuation allowances for loan losses for pools of loans with similar risk characteristics, such as property
types, loan-to-value ratios and debt service coverage ratios when, based on past experience, it is probable that a credit event has occurred
and the amount of loss can be reasonably estimated. These valuation allowances are based on loan risk characteristics, historical default
rates and loss severities, real estate market fundamentals and outlook, as well as, other relevant factors.
The determination of the amount of, and additions or decreases to, valuation allowances is based upon the Company’s periodic evaluation
and assessment of known and inherent risks associated with its loan portfolios. Such evaluations and assessments are based upon several
factors, including the Company’s experience for loan losses, defaults andlossseverity,andlossexpectationsforloanswithsimilarrisk
characteristics. These evaluations and assessments are revised as conditions change and new information becomes available. We update
our evaluations regularly, which can cause the valuation allowances to increase or decrease over time as such evaluations are revised.
Negative credit migration including an actual or expected increase in the level of problem loans will result in an increase in the valuation
allowance. Positive credit migration including an actual or expected decrease in the level of problem loans will result in a decrease in the
valuation allowance. Such changes in the valuation allowance are recorded in net investment gains (losses).
See “Investments — Mortgage Loans” in Note 3 of the Notes to the Consolidated Financial Statements for a table that presents the activity
in the Company’s valuation allowances, by portfolio segment, for the years ended December 31, 2010, 2009 and 2008, respectively; and for
tables that present the Company’s valuation allowances, by type of credit loss, by portfolio segment, at December 31, 2010 and 2009,
respectively.
The Company held $197 million and $210 million in mortgage loans which are carried at estimated fair value based on the value of the
underlying collateral or independent broker quotations, if lower, of which $164 million and $202 million relate to impaired mortgage loans
held-for-investment and $33 million and $8 million to certain mortgage loans held-for-sale, at December 31, 2010 and 2009, respectively.
These impaired mortgage loans were recorded at estimated fair value and represent a nonrecurring fair value measurement. The estimated fair
value is categorized as Level 3. Included within net investment gains (losses) for such impaired mortgage loans were net impairments of
$17 million and $93 million for the years ended December 31, 2010 and 2009, respectively. Subsequent improvements in estimated fair value
on previously impaired loans recorded through a reduction in the previously established provision to the valuation allowance are reported as a
(release) above.
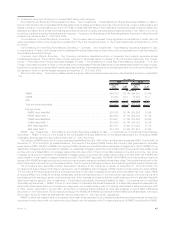
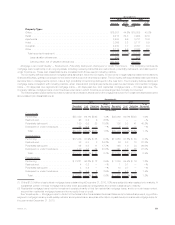
Real Estate and Real Estate Joint Ventures
The Company diversifies its real estate investments by both geographic region and property type to reduce risk of concentration. Of the
Company’s real estate investments, 88% are located in the U.S. with the remaining 12% located outside the U.S., at December 31, 2010. The
carrying value of the Company’s real estate investments was $8.0 billion, or 1.7%, and $6.9 billion, or 2.0%, of total cash and invested assets
at December 31, 2010 and 2009, respectively. See “Investments — Real Estate” in Note 3 of the Notes to the Consolidated Financial
54 MetLife, Inc.